
Key Trends in 2024
The “Fourth Industrial Revolution” is well underway. Back in 2011, economist Klaus Schwab coined the term to refer to the rapid digitization and accessibility of technologies that spark a global shift in processes – in everything from how we communicate to how businesses and governments are managed.

The “Fourth Industrial Revolution” is well underway. Back in 2011, economist Klaus Schwab coined the term to refer to the rapid digitization and accessibility of technologies that spark a global shift in processes – in everything from how we communicate to how businesses and governments are managed[1].


Drone image by Florian Pircher from Pixabay

Building information model of a mechanical room developed from lidar data (image provided by Yelda Turkan, OSU College of Engineering).
More a decade later, this revolution is accelerating, driven by the widespread use of cloud computing, “big data”, virtual reality and artificial intelligence (AI). These “disruptive technologies[2]” are fundamentally changing our lives and how we do our jobs. All industries, including surveying and civil engineering, are leveraging these new technologies to automate tasks, increase precision and generate more useful data.
Integration of 3D Laser Scanning Technology (LiDAR)
3D laser scanning traces back to the early 1960s when researchers experimented with laser technology to measure distances and create 3D representations of objects. The first practical applications of laser scanning emerged in the 1970s, in the field of surveying and topographic mapping. However, 3D laser scanning didn’t become useful until advancements in computing power and data processing capabilities were integrated with portable scanning technology. Today, surveyors can combine 3D scanners with their total stations to measure distances and create accurate three-dimensional representations of the surveyed area. The use of 3D laser scanning enhances data collection speed, accuracy, and enables more comprehensive visualization and analysis[3]. Berntsen offers a line of laser targets designed to work with these advanced systems – enhancing accuracy and ensuring repeatability.Drones
Drones equipped with high-resolution cameras and LiDAR sensors capture imagery and terrain data, allowing surveyors to obtain valuable insights for mapping, topographic surveys, and volumetric calculations. This technology makes it possible to survey inaccessible areas, reducing field time and increasing the efficiency of data collection and processing[3]. Of course, having accurate reference points is key to successful aerial surveying – see how Berntsen’s drone targets can work for you.Building Information Modeling (BIM)
BIM uses a range of technologies to create a digital representation of a structure or infrastructure project, integrating survey data with architectural, engineering, and construction information. Surveyors contribute crucial geospatial data to BIM models, facilitating clash detection, accurate quantity take-offs, and construction coordination. BIM enhances collaboration among project stakeholders, reduces errors, and enhances overall project efficiency[3]. Berntsen helps surveyors ensure BIM data precision with its line of smart targets and reflectors.
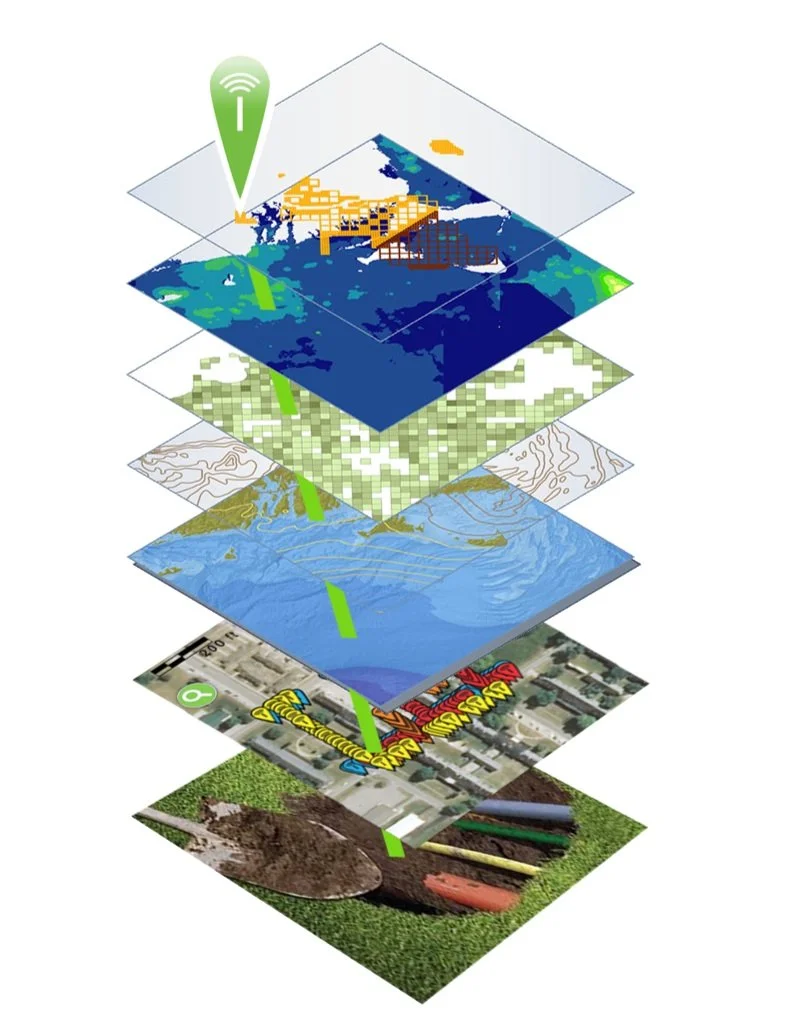
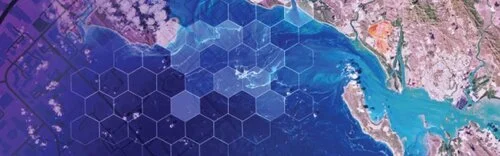
Layers in Geographic Information Systems, augmented with RFID
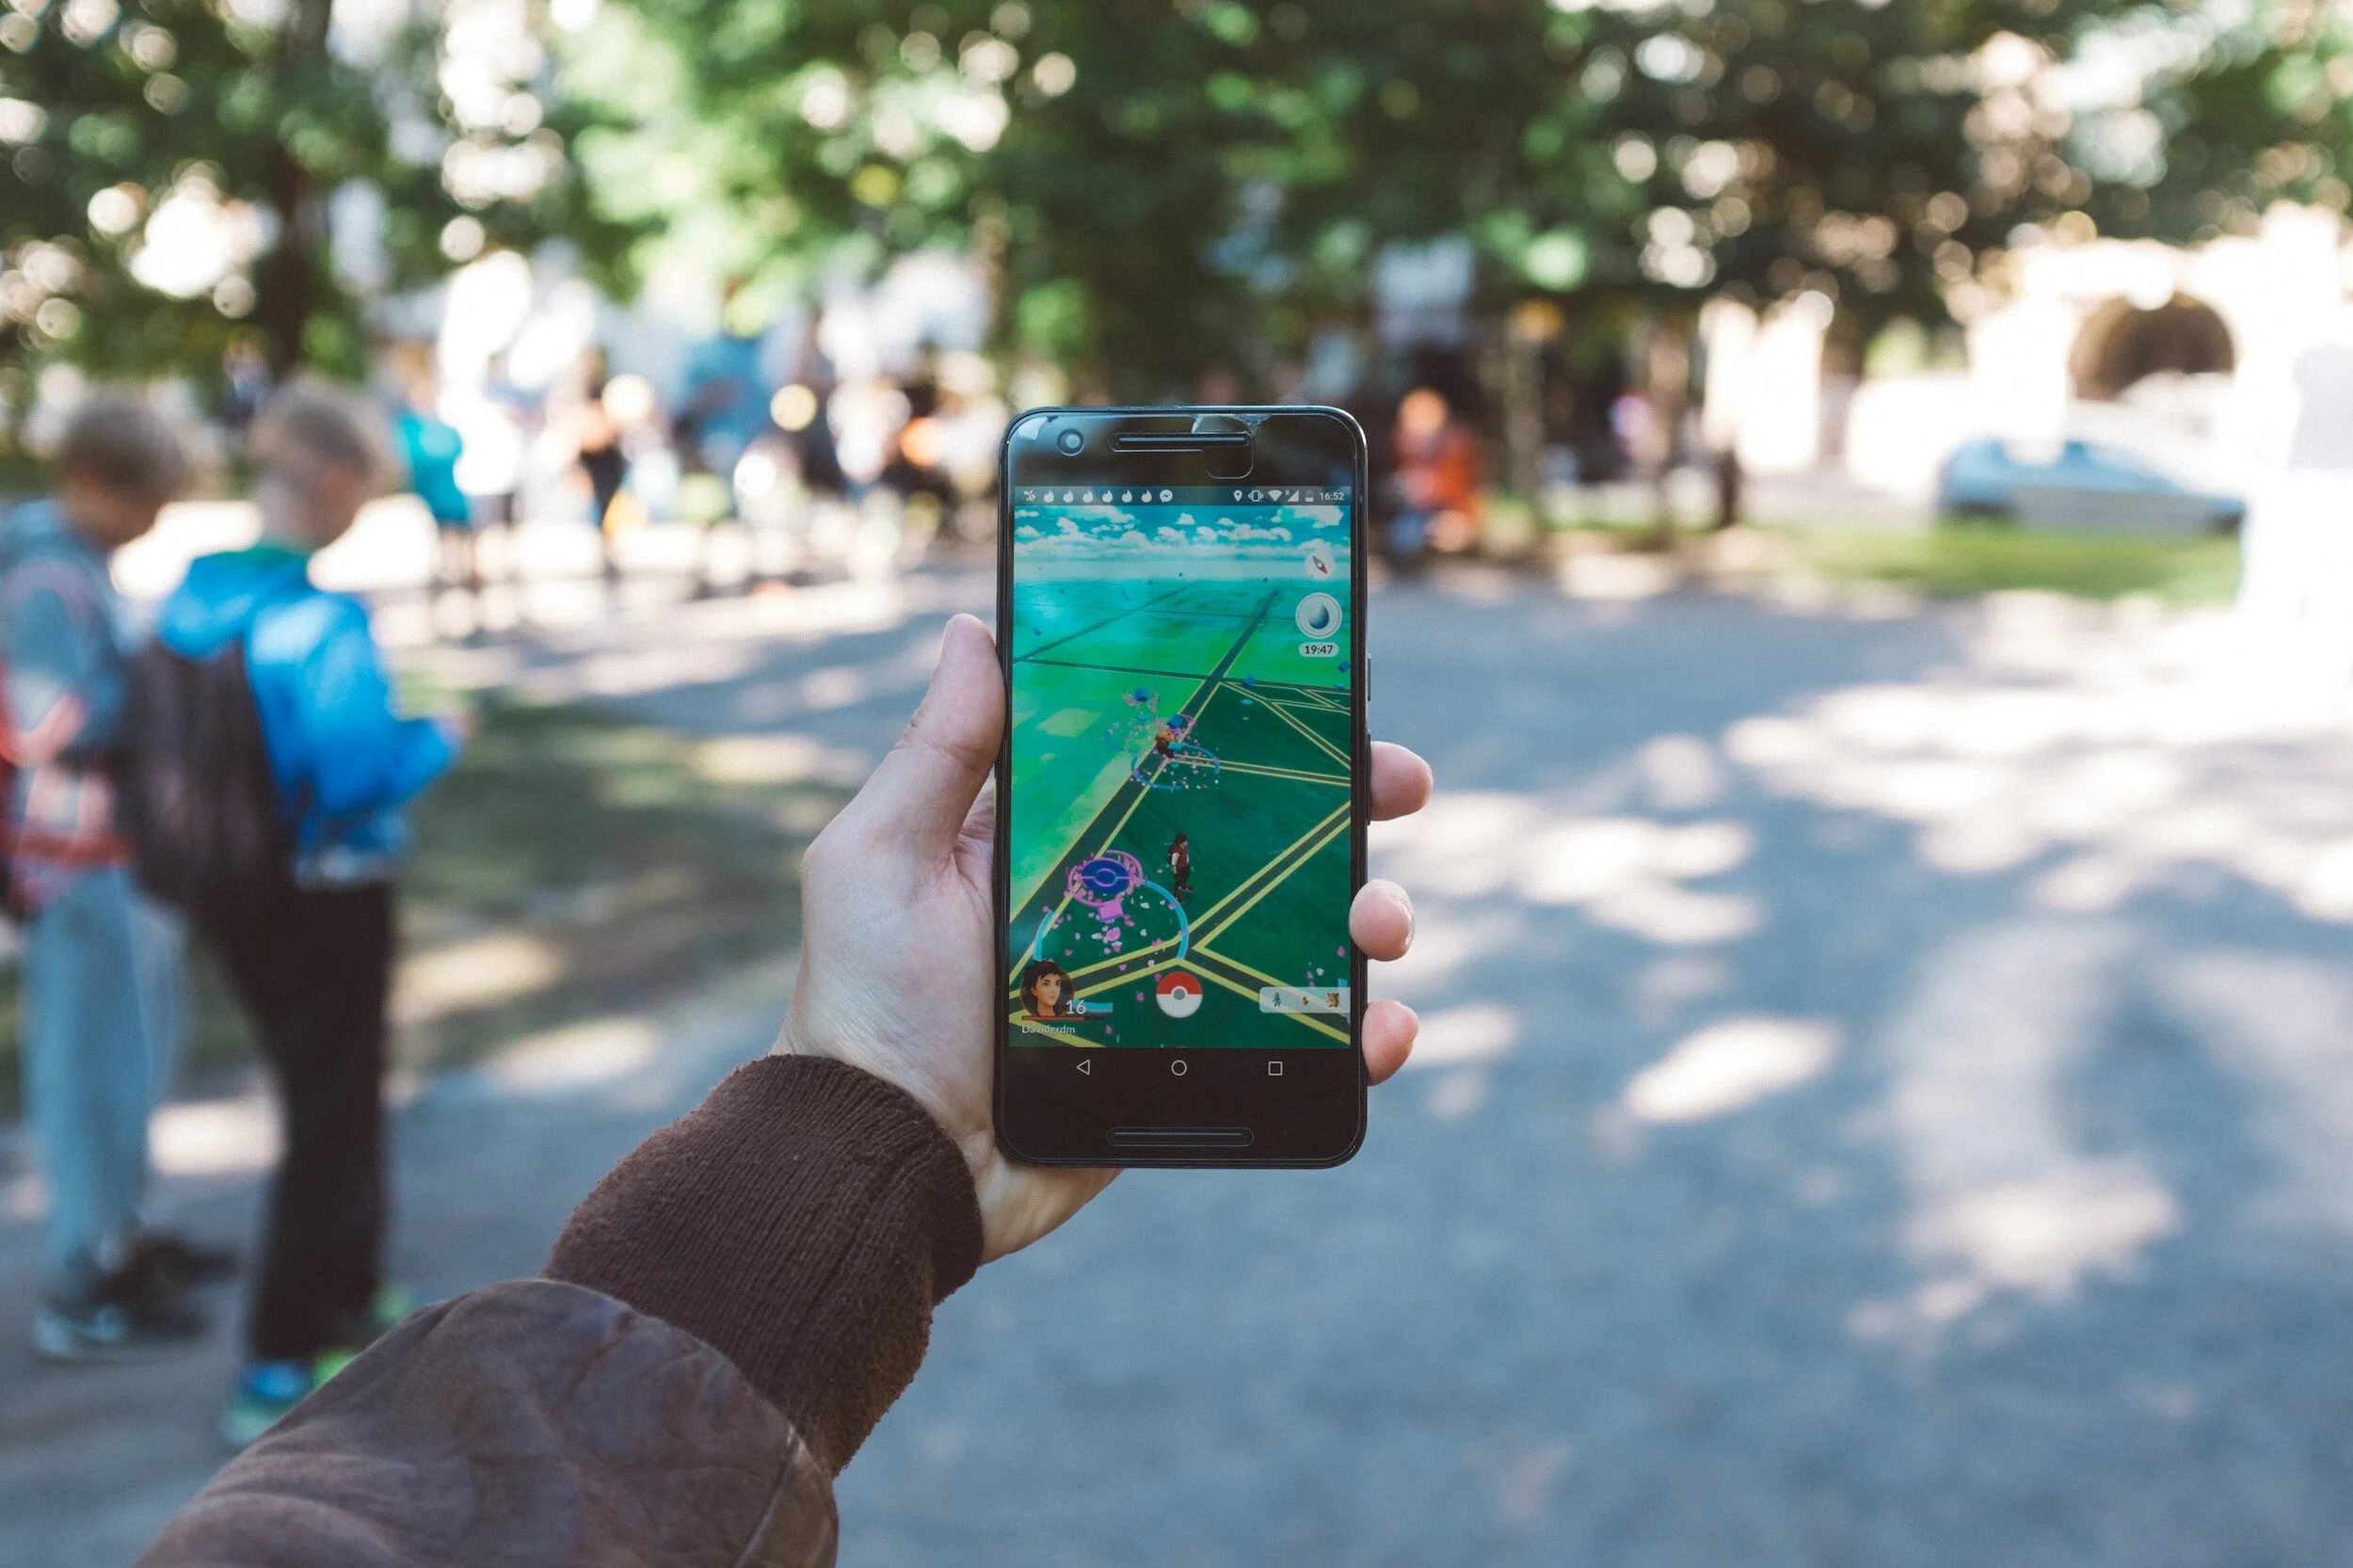
Augmented Reality (AR) and Virtual Reality (VR) Applications
Augmented Reality (AR) and Virtual Reality (VR) technologies are finding their way into land surveying practices, offering immersive experiences and enhanced visualization. AR and VR applications enable surveyors to overlay survey data onto the real world or create virtual environments for project planning and simulation. These technologies aid in communication, decision-making, and public engagement, providing stakeholders with a better understanding of the surveyed area and proposed designs[3]. These visualizations are extremely precise when surveying measurements include the use of high-quality prisms that help ensure accuracy – available from Berntsen.Geographic Information Systems (GIS)
Cloud-based Geographic Information Systems provide centralized storage, access, and analysis of map-based survey data. GIS is another technology that was first developed in the 1960s using existing spatial analysis and visualization methods, combined with computing power, to identify and manage land characteristics and use over large areas. Soon the usefulness of a spatially based approach to data visualization and analysis was applied to a vast range of functions. Today, GIS is becoming more and more powerful through the integration of other technologies, including Radio Frequency Identification (RFID) and AI.
Radio Frequency Identification (RFID)
As data visualization gets better and better, it becomes increasingly important to ensure that the data itself is precise. That’s where RFID comes in. RFID literally ties the physical to the digital, authenticating any marked asset at its physical location. An RFID tag, placed on anything anywhere can be instantly read on-site, activating its full data record from the GIS or BIM platform. Today, the combination of GIS and RFID is used to verify and manage a vast array of items – from infrastructure assets to dinosaur bones. Berntsen offers a full range of RFID tags and software that integrate with GIS, BIM and other platforms to provide instant authentication to any asset, anywhere.Artificial Intelligence (AI)
AI is set to bring another wave of change to the way we live. AI is the ability of a machine to display human-like capabilities such as reasoning, learning, planning and creativity. AI enables technical systems to perceive their environment, deal with what they perceive, solve problems and act to achieve a specific goal. The computer receives data - already prepared or gathered through its own sensors such as a camera - processes it and responds. AI systems can adapt their behavior to a certain degree by analyzing the effects of previous actions and working autonomously[4].
Combining AI with geographic information system (GIS) and RFID technology delivers real-world context and authentication to operations.

According to Esri, close observers of AI have noted that as an analytic tool, much of what it accomplishes falls into three main categories in which AI and location intelligence fit seamlessly:
Automate tasks and repeat them quickly at scale. A utility company can use AI and location intelligence, along with drone [and RFID] technology, to examine utility poles and wires, determining where telltale signs suggest repairs are necessary.
Look at past patterns to make predictions. A logistics or manufacturing company can use AI and location intelligence to optimize supply chains, considering such disparate data as weather forecasts, the likelihood of ship and rail traffic backup, and how many left-hand turns there are on driving routes.
Search for patterns hidden in large amounts of data[5].
A key point

In the midst of the Fourth Industrial Revolution, it’s important to remember that there are some things that data, computing and visualization can’t do. Every person exists in the physical world, not as a consumer or data point, but as living, breathing, thinking being.
At Berntsen, we put people first, by caring for our customers, anticipating future needs, and providing personal support, from live webinars to one-on-one meetings. We all want to leave our mark, and Berntsen is here to help.
References:
[3] https://www.pointscan.co.uk/the-evolution-of-3d-laser-scanning/
[5] https://www.esri.com/content/dam/esrisites/en-us/media/ebooks/artificial-intelligence.pdf
Background:
https://www.landform-surveys.co.uk/news/thoughts/ai-surveying/
https://www.linkedin.com/pulse/emerging-trends-land-surveying-practices-primaverse/

It’s National 811 Day —
811 Day was created to bring attention to a significant but little-known issue – the high cost and safety impacts of underground utility strikes.
Quantifying the cost and safety impacts of utility strikes is difficult. A compilation of various studies estimates that the direct cost of each strike is $4,000 -- but that doesn’t take into consideration the cost to repair and restore the damage.

Little-known but incredibly important
811 Day was created to bring attention to a significant but unfamiliar issue – the high cost and safety impacts of underground utility strikes.
Quantifying the cost and safety impacts of utility strikes is difficult. A compilation of various studies estimates that the direct cost of each strike is $4,000 -- but that doesn’t take into consideration the cost to repair and restore the damage. Taken together, the cost of the strike plus the cost of restoration, the total is 29 times the cost of the direct damage itself [1]. Because utility strikes are often not reported, the frequency of occurrence is merely an estimate. With more than 20 million miles of buried pipelines, cables, wires and other facilities, the Common Ground Alliance (CGA) estimates that there are at least 400,000 utility strikes per year in the United States. In 2021, the cost of utility strikes to the US economy was estimated to be more than $30 billion.
Utility strikes have been a problem for a long time – ever since the 1850s when the first underground sewer systems were built in Chicago and Brooklyn.
Act of Congress
It wasn’t until 1994 that the government got involved. At that time, Congress required each state to develop a One-Call system with a centralized number to call in advance of digging. The goal of the one-call system is simplicity. Any person or company planning to excavate can call an in-state number and the utility companies would be notified to send a Utility Locator to find and mark utilities using spray paint and/or flags. Unfortunately, the number of One-Call Centers quickly grew to 71, each with its own 10-digit phone number, making it confusing and taxing to notify the right people before breaking ground.
In response, in 1995, the FCC designated 811 as the nationwide number to call (or click) to protect pipelines and other utilities from excavation damage.
Today, 811 is contacted nearly 40 million times annually [2].
Despite the fact that use of 811 one-call centers rose by eight percent from 2020 to 2021, “No notification made to 811 center” remains the top root cause of utility strikes with over a quarter of all damages still attributed to no notification)[3].
Much more to be done
Although it’s simpler than ever to call for utility location, utility strikes remain a major drag on the American economy. Fortunately, emerging technology is being used to produce precise maps of underground utilities that speed the process of identifying and locating underground utilities.
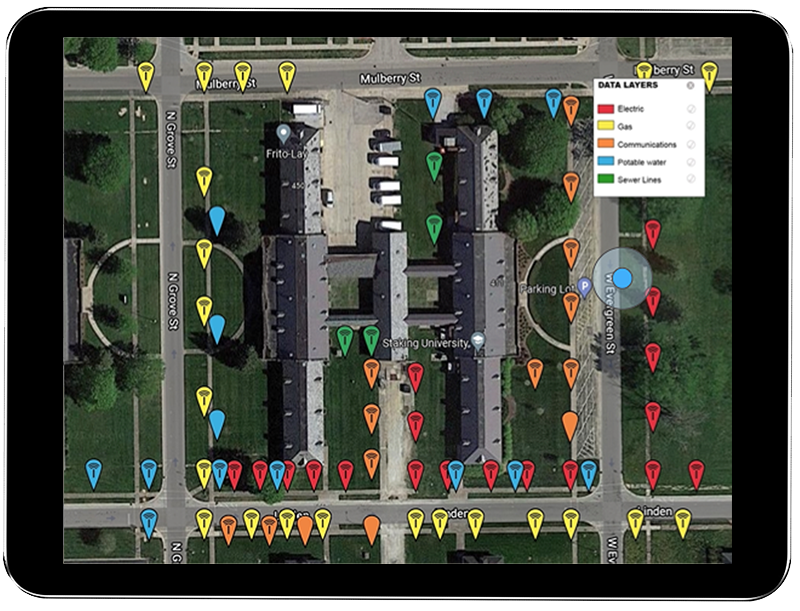
For example, Geographic Information Systems (GIS), are being used by growing numbers of utilities, municipalities and excavators to create and share data about underground utilities. Unfortunately, having an accurate map of all utilities in a given area is rare, because not every contractor or owner working on a job site uses GIS to map utilities. That’s when another technology, Radio Frequency Identification (RFID), can make all the difference. Magnetic RFID tags can be buried with any type of utility and will display its identity, owner and other information with a simple scan. This data can be incorporated into GIS (such as Esri’s ArcGIS) through data collection apps on mobile devices. RFID is agnostic, so it will work with any utility, above or below ground.
RFID and GIS are key
Passive RFID tags don’t require power (they activate only when scanned) so they can last underground for years. A recently released study describes how RFID has been used to mark and manage utilities over a period of seven years. The study concluded that magnetic RFID marking, coupled with GIS mapping, is a low-cost, reliable solution for underground infrastructure locating and management.
Marking underground utilities with magnetic RFID is a long-term solution that streamlines future utility locating processes while providing the means to connect to digital mapping systems for efficient utility management -- from water pipes to fiber-optic cables. Utility location verified by RFID, provides a highly accurate method for utility owners to manage all of their infrastructure facilities.
Today, on 8/11 calling 811 remains essential part any excavation, from individuals working in their backyards to construction companies about to break ground on a new project.
References:
[3] https://dirt.commongroundalliance.com/2021-DIRT-Report/Executive-Summary#mainContentAnchor
Sources:
https://www.4manalytics.com/blog/29-1-the-cost-of-striking
The 811 Logo is a registered trademark of the Common Ground Alliance

RFID - the technology that keeps on giving
We’ve all heard of RFID, a technology that’s been around since the 1930s. Did you know that it’s now one of the fastest-growing technologies in the world?
We’ve all heard of RFID, a technology that’s been around since the 1930s. Did you know that it’s now one of the fastest-growing technologies in the world?
Originally discovered during the development of radar, Radio Frequency Identification (RFID) has proven useful in all kinds of applications, from tracking library books to identifying lost pets to providing visibility into complex supply chains.
The technology is simple and versatile, consisting of a tiny RFID chip/antenna and a RFID reader that interrogates the chip via radio waves. No line of sight is required, and the tiny chips don’t require batteries – the power comes from the RFID reader.
Exponential RFID Market Growth

According to a presentation at the recent RFID Journal Live Conference (May 9-11, 2023), the RFID tag market is growing exponentially. This vibrant market growth will continue as RFID is integrated into more and more systems, including Geographic Information Systems, robotics and more.
The lasting impact of one person on the industry
Early on, in 2002, a reporter for Information Week realized the potential of the fledgling RFID market. About that time, manufacturing companies were trying to get a handle on how to prevent pervasive problems with inventory management and managing shipping information. RFID was one of the many technologies that was being tested to help resolve these problems. The reporter, Mark Roberti, focused his investigative skills on learning all he could about this fledgling technology. Little did he know that the result of his efforts would create a new career and an industry powerhouse.
Soon, Roberti created a website just to post his RFID articles, but it wasn’t until a reader asked about a subscription to the website that he realized he could make money by sharing his fascination with RFID. By 2003, Roberti was organizing annual conferences and online events. In 2007, his efforts received an unexpected boost by a corporate mandate by Walmart – that all suppliers must begin using RFID tags to mark their products. Of course, this mandate resulted in a rush of interest in RFID, as well as a lot of pushback from suppliers. More importantly, a patent holder for RFID technology began to enforce its patents. This stymied the corporate investment in RFID -- until Roberti stepped in and helped the industry manage licensing issues.
Before the advent of social media and e-commerce, the RFID industry found itself the focus of misinformation. In 2008, some consumer organizations began boycotting clothing with embedded RFID tags, erroneously believing that the tags would enable companies to spy on their customers. These groups got a lot of media attention, but the inherent versatility of RFID enabled manufacturers to resolve the issue (if not the misinformation). The RFID tags were simply placed on removable tags.
Growing with RFID

Back in 2010, Berntsen recognized the potential RFID could have on marking and managing underground infrastructure. Leveraging its broad expertise in infrastructure marking, the company began developing a system based on RFID technology that enabled users to digitally locate and manage their infrastructure assets. Unlike mapping or GIS platforms, an RFID-based system starts with the physical asset marked with an RFID tag. A simple scan of the tag verifies the asset’s identity and ties it to its specific digital record in a corresponding digital platform. RFID alone can provide this two-factor verification of any asset – a benefit especially relevant for buried infrastructure assets.
Today, Berntsen’s InfraMarker Connected RFID is leveraged by Esri to provide RFID verification to its customers that rely on ArcGIS to manage their assets. More and more organizations are benefitting from the versatility and security of InfraMarker RFID.

Marking and Mapping – Two Factor Verification for Underground Locating
It’s spring and construction is booming . . . hopefully with fewer actual “booms”, caused by utility strikes. Safe digging is something that’s near and dear to surveyors and any profession that involves excavation. As I mentioned in my last blog, preventable utility strikes cost at least $60 billion annually, not to mention the loss of life and life-altering injuries that can occur.
Blog by Emily Pierce, PLS, CFedS
It’s spring and construction is booming . . . hopefully with fewer actual “booms”, caused by utility strikes. Safe digging is something that’s near and dear to surveyors and any profession that involves excavation. As I mentioned in my last blog, preventable utility strikes cost at least $60 billion annually, not to mention the loss of life and life-altering injuries that can occur.
Geographic Information Systems (GIS)
GIS has emerged as a leading approach to managing utility assets and will become an essential tool for subsurface utility management. But regardless of how accurate GIS maps become, there will always be the need to validate the digital representation of the underground assets depicted in the maps with high quality in-field marking products. Mapping and marking is required.
In today’s world, this is called ‘two-factor’ verification and it is used in solutions like Uber (mobile map coupled with driver verification on arrival), online banking (text to phone to validate your account ownerships you) and your doctor’s office (“please tell me your name and date of birth”).
Surveyors have practiced this for years by using maps and then relying on Berntsen survey markers in the field. Two-factor verification drives safety, reduces errors in identification, and improves operational performance. There is no industry with greater need for two-factor verification than underground locating.
Technology to the Rescue
It is this two-factor verification that Berntsen has been working on with its InfraMarker RFID underground locating solutions. Tying an underground RFID asset identifier to a GIS delivers the best of both worlds – an accurate map with in-field verification.
I can’t help but think of the impact Connected RFID could have on preventing utility strikes if it was widely used. An RFID underground marker has a unique identifier tied to a GIS record so a field worker can identify the asset or particular location – not simply type of utility – before excavating. And RFID is utility agnostic, so the same locating and identification process works for water, gas, electric, or fiber.
We use two-factor verification to make sure we don’t get into the wrong Uber. Why can’t we take the same two-factor approach to make sure that we have safer underground digging?
Questions? Let us know!

It’s National Engineers Week!
Most engineers would argue that it’s always engineers week, but this week is the “official” week to highlight the stunning array of engineering accomplishments and types of engineering that make our lives easier in every way.
Most engineers would argue that it’s always engineers week, but this week is the “official” week to highlight the stunning array of engineering accomplishments and types of engineering that make our lives easier in every way.
The recent focus on infrastructure has helped bring engineering to the forefront. The tremendous work engineers have done to design and built our bridges, roads, airports is obvious for all to see. And everyone can see what happens when structures outlive their projected lifespan, not maintained properly or not replaced on schedule.

Dr. Snow’s waterworks map of 1846 from the UCLA Epidemiology John Snow Site.
However, many engineers are focused on the infrastructure we don’t see – the underground infrastructure, such as stormwater systems, buried telecom cables, gas and other buried pipelines. It’s a different world below ground where all these systems exist, conflict, age and require maintenance. In the past few years, enormous strides have been made to identify and map underground utilities and structures using new engineering approaches, as well as Geographic Information Systems (GIS).
GIS is a technology that uses maps to visualize data. GIS first appeared as a map created by Dr. John Snow in 1854. He plotted all the cholera outbreak locations in London, along with roads, property boundaries and water lines. His map revealed that cholera outbreaks were clustered around a water pump, challenging the existing notion that cholera was spread through the air. Along with creating one of the first uses of Geographic Information, Dr. Snow also is credited with starting the field of Epidemiology.
MAPPING + COMPUTERS
Mapping and analysis continued to be done on paper until the 1960s. Then, along came Roger. Roger Tomlinson was a British-trained geographer and geologist who worked for the Government of Canada and for an Ottowa-based aerial survey company. He figured out a way to computerize the process. While working on a project to identify the best location for a tree plantation in Kenya, Tomlinson partnered with IBM to find a way to bridge the gap between geographic data and computer services. This initiative was eventually extended to create a national mapping system that created maps of Canada’s commercially-leveraged land used for agriculture, forestry, wildlife and recreation. It was during this project that Tomlinson created the term “Geographic Information Systems” to describe his synthesis of computer mapping with capabilities for overlay, measurement, and digitizing.
SMART CITIES

Today, GIS, ground-penetrating radar and other emerging technologies are helping utilities and cities build a digital map that captures the exact location of utilities. This is a major part of any “Smart City” initiative.
Unfortunately, a disconnect between the real world and the digital world persists, despite all the technology. For example, a growing number of municipalities are using GIS systems to manage the inspection and maintenance of various types of utilities, including stormwater assets. The stormwater manager will use the GIS to schedule inspections, assuming that the data in the GIS is accurate. When the field crew arrives at the scheduled location, they often discover that the data in the GIS simply doesn’t match what they actually see when they arrive. The assets may not be where they are supposed to be, including above-ground assets such as manholes and catch basins. This confusion and uncertainty waste a lot of time which can leading to errors.
CONNECTED RFID

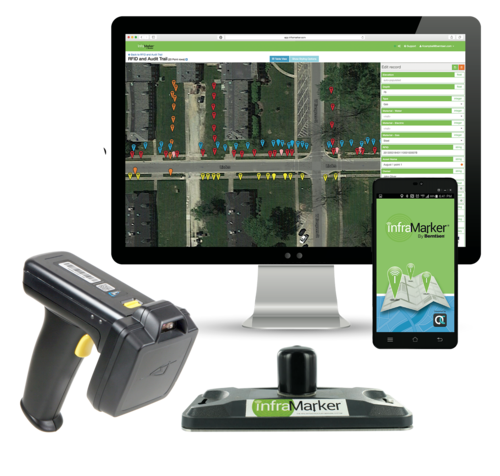
InfraMarker Connected RFID
Fortunately, there is now a technological solution that ties the digital world directly to the real world using RFID, the fastest-growing asset ID technology in the world. Engineers at Berntsen International leverage both GIS and RFID to create a simple approach to resolve the digital/reality disconnect. RFID tags, each with its unique ID, are placed on any type of asset. Then the asset ID is connected to its specific record in GIS. A quick scan of the asset will load any applicable forms for the field staff to fill out. This connection means that assets (even underground assets) are correctly identified, and the record is accessible where it counts – in the field for updating and in the office for scheduling.
This simple approach, called InfraMarker Connected RFID, has broad implications for infrastructure asset management. It improves asset locating and identification, speeds inspection and maintenance workflows, reduces errors and supports compliance requirements.
Additionally, Connected RFID provides an important safety mechanism for the management of buried assets. Everyone has seen news stories about gas lines, telecom cables or water mains being accidentally struck during construction. Sometimes these accidents involve injury and/or loss of life, and they almost always result in property damage and loss of service. In 2019, an estimate of the annual societal costs from damages to buried utilities was approximately $30 billion.
If buried assets were marked with RFID, they could be quickly located and identified with a simple RFID scan. Important information about other nearby buried utilities can be easily added to an asset record in GIS, making that information accessible and shareable across utilities.
Thanks to engineers, this technology is available today, making infrastructure asset management more efficient, more useable, and safer.

Blossoming Blooms
Harmful algae blooms (HABs) are occurring more and more frequently in lakes, rivers, streams and coastal areas across the United States. Further, HABs are occurring where they were never found in the past. View a map from the Natural Resources Defense Council that tracks HABs across the United States.
CONTAINING THE THREAT OF HARMFUL ALGAL BLOOMS (HABS) IN URBAN ENVIRONMENTS
Harmful algae blooms (HABs) are occurring more and more frequently in lakes, rivers, streams and coastal areas across the United States. Further, HABs are occurring where they were never found in the past. View a map from the Natural Resources Defense Council that tracks HABs across the United States.
The chart below tracks the number of reports of algal blooms over time up to October 2021.
NUMBER OF HARMFUL ALGAL BLOOMS IN THE U.S. BY YEAR

WHAT IS A HARMFUL ALGAL BLOOM?
An algal bloom is an overgrowth of microscopic algae or algae-like bacteria in fresh, salt or brackish water. Many type of algae or bacteria can produce algal blooms; not all are toxic and not all are harmful. Less than one percent of algal blooms produce toxins; harmful algal blooms (HABs) are those that have negative impacts on humans, marine and freshwater environments and coastal areas.
The most common types of harmful freshwater algal blooms are caused by cyanobacteria. Some types of cyanobacteria can produce dangerous cyanotoxins. Some of these cyanotoxins can attack the liver, kidneys, central nervous systems, skin and lungs, resulting in serious damage or even death.
WHAT CAUSES HARMFUL ALGAL BLOOMS?
HABs can occur naturally, but the increasing prevalence and frequency is caused by:
Nutrient pollution, such as agricultural runoff, wastewater and stormwater runoff (which is increasing due to more frequent severe rainfall events).
Warmer temperatures.
Still water, such as in dams, canals and other man-made waterways.
STORMWATER MANAGEMENT – THE FIRST LINE OF DEFENSE AGAINST HABS
HABs have a significant, yet largely unmeasured economic impact. Looking at just the recreation and tourism industry, a single harmful algal bloom event in a lake in Ohio cost $37-$47 million in lost tourist revenue over two years.*

The reduction of nutrient pollution is the most accessible and effective method of reducing algal blooms in urban areas. It is estimated that 10 trillion gallons of untreated stormwater now flow into our lakes, rivers, streams and coastal areas.
Many municipalities are implementing asset management programs (AMPs) to help quantify and manage their stormwater infrastructure. Because infrastructure was built over a long period of time, it’s likely that documentation fragmented and inaccurate, which makes efficient maintenance very difficult. Actually knowing the location and condition of infrastructure assets goes a long way in creating a proactive plan to inspect, manage and repair existing assets.
SMALL INVESTMENTS IN PROVEN TECHNOLOGY CAN MAKE A BIG DIFFERENCE

Reading an RFID marker on a catch basin.
Fortunately, cost-effective technology is available to help make efficient asset management available to municipalities. Rather than keeping track of stormwater assets on paper and then digitizing the information, many municipalities have gone digital, using Geographic Information Systems (GIS) to keep track of their catch basins, swales, hydrants and other assets. However, in many cases, even if all the assets are viewable on a GIS system, truly useful data is not.
For example, a single intersection may have literally dozens of manholes, storm drains, catch basins, hydrants and other assets that require regular inspection and maintenance. GIS systems don’t have a way to identify discrete assets in close proximity. That’s where the InfraMarker system comes in. It offers a way to link verified physical location with the digital world using simple, proven technology.
Any asset that is marked with a RFID tag can be linked to unlimited asset information in a GIS using a simple mobile app. Field technicians can verify with certainty where they’re at and then link their maintenance activity with that specific asset – no guesswork or wasted time involved.
Asset managers benefit because they can view all assets online and delve into each specific record to view videos, photos and any other documentation the field tech has attached to the specific tag. An audit trail has been created so asset managers can schedule inspections and maintenance knowing that there will be no confusion or wasted time in the field dealing.
*Estimated Annual Ecomonic Impacts from Harmful Algal Booms (HABs) in the United States, WHOI-2000-11.

It’s GIS Day!
Most people don’t really think about how geographic information provides the framework for our entire existence. We exist as living organisms in time and space. Our minds may be occupied with far-way thoughts, but our memories are inextricably tied to the place where they were created. As long as we live and breathe, we always have a location.
Blog by Emily Pierce, PLS, CFedS

Most people don’t really think about how geographic information provides the framework for our entire existence. We exist as living organisms in time and space. Our minds may be occupied with far-way thoughts, but our memories are inextricably tied to the place where they were created. As long as we live and breathe, we always have a location. Shakespeare’s Hamlet said “To be or not to be, that is the question.” Surveyors say, “To be is to occupy a position relative to two axes.”
Surveyors are trained to understand the implications of geography and location differently than most people. Precision is applied to location and this information has been the basis for civilizations for thousands of years. I’ve written about ancient surveying instruments in previous blogs: Ancient Egyptian Surveying and Ancient Roman Surveying.
Today, geographic information is more important than ever and is being used in ways that were previously unimaginable. As a surveyor, I had the opportunity to work with Geographic Information Systems (GIS) early on, mainly by being the boots on the ground that provided accurate geographic data that was subsequently used in GIS. We provided accurate survey-grade locations on US Public Land Survey corners (section and quarter-section corners) to be utilized into a county tax parcel database. This not only helped improve how the county taxed its citizens, it also helped citizens with land development, taking into account appropriate building sites, flood zones, wetland preservation, general zoning requirements, just to name a few. Beyond that, the GIS also is used for school and voting districts, changes in municipal boundaries and incorporations, addressing, and emergency response management.
Nothing stays the dame
Change has accelerated quickly in the years since I started working with GIS, as evidenced by a 2009 article entitled the “Top Five Benefits of GIS”, with number one benefit being cost savings from greater efficiency using location-based data.
The example cited was Sears, which was able to use GIS to reduce the time it took for dispatchers to create routes for their home delivery trucks by 75%. I’m sure that was a huge savings, but unfortunately for Sears, Amazon was already taking over on every front. By 2021, the Sears footprint had shrunk from 3,862 stores in 2009 to just 19 stores and a website.
Route optimization is only one of the thousands of applications of GIS technology. From precision farming to spatial econometrics (the intersection of spatial analysis with economics) to creating ultra-precise road maps to facilitate autonomous vehicles. Check out the 1,000 Uses of GIS for a glimpse into the future.
When researching this blog, I learned about a project where Toyota is using a platform that gathers crowd-sourced data from vehicle cameras and combines it with high-precision GPS and GIS to create precise and up-to-date road information. This information will be used for autonomous driving in the future, or probably already is!
What?!
Interestingly, a whole new industry is being created around monetizing the vast amount of data that is generated from vehicles. McKinsey estimates the market for this information might add up to $450-650 billion by 2030. I wish there was some way I could get a cut of these billions!
You may not even realize that the navigation systems in your vehicles are GIS. I’m partial to the Waze app. I love how they incorporate real-time data on reported crashes, speed traps and even roadkill, (important to know, because we have lots of moose and deer up here)! All this can be narrated by people from Dexter on Showtime to PAW Patrol on Nickelodeon.
Other GIS uses

Pretty much everyone knows about the Johns-Hopkins COVID map but did you know that there’s a HealthMap that maps reports the location of all kinds of diseases? For example, in the past month, Legionnaires’ Disease was found in three locations in the U.S. Definitely worth looking at before traveling. NASA is also providing satellite data to cancer researchers to help pinpoint the types of human activity that lead to cancer in geographic areas. The Landsat Program is the longest continuous space-based record of Earth’s land in existence.
As you know, I’m a history buff, and I really like the ArcGIS Online Historical Maps. It makes all the USGS topographical maps accessible. All you need to do is find a place, and any maps that USGS has on it over time will be available. I just downloaded this map form 1890 of New Orleans.
I could go on and on, but I invite you to check out the many ways GIS is being used today.
I know in the past, many surveyors thought that GIS was going to obsolete the profession, but that is definitely not the case. We still need boots in the field tying the data in digital maps to real places in the real world. I’m personally involved in introducing a product that does just that, using RFID to literally tie the physical to the digital. Check it out at inframarker.com. It’s a great product with as many applications as GIS itself.
Emily Pierce is a surveyor and Berntsen’s Business Development Manager. Learn more - email: info@inframarker.com

GIS DAY IS NOVEMBER 18
Little did I know that dusty old geography would become the one of the most interesting (and explosively-growing) fields in science. Today Geographic Information Systems (GIS) is shaking up the world of geography – and statistics, data analysis, spatial data, modeling, geostatistics, cartography, data integration, GPS – and on and on.
By Emily Pierce, PLS, CFedS
When I was in college, geography seemed to be a dying academic field. Nevertheless, it was where I found my true passion for geography, while everyone else was there just to satisfy a required General Ed. requirement. It was, for nearly everyone in my class, something they HAD to do. For me, it felt like home. I realized this was a field I wanted to pursue and learn more about. Fortunately, that class, and that instructor, inspired me to research professions in geography, and soon after, I found surveying – a truly interesting way to use maps to create something of lasting value.
Little did I know that dusty old geography would become the one of the most interesting (and explosively-growing) fields in science. Today Geographic Information Systems (GIS) is shaking up the world of geography – and statistics, data analysis, spatial data, modeling, geostatistics, cartography, data integration, GPS – and on and on.
1854 – The Beginning

Dr. Snow’s waterworks map of 1846 from the UCLA Epidemiology John Snow Site
GIS first appeared as a map created by Dr. John Snow in 1854. He plotted all of the cholera outbreak locations in London, along with roads, property boundaries and water lines. His map revealed that cholera outbreaks were clustered around a water pump, challenging the existing notion that cholera was spread through the air. Along with creating one of the first uses of Geographic Information, Dr. Snow also is credited with starting the field of Epidemiology.
Soon, plotting data on maps became more common – besides public health applications, insurance companies used them to plot firesand thereby compute insurance rates, Governmental tax offices plotted property lands to evaluate tax rates, and natural resource departments plotted wetland areas, flood zones, and water bodies to help protect our waterways and natural habitats. More and more types of data were plotted on maps, but it was painstaking work.
1960 – Computer Mapping
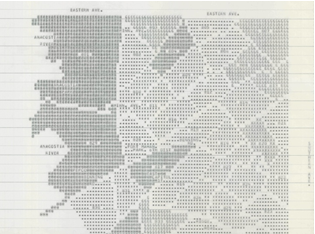
Early Computer Map of the Crime Statistics of Washington,DC
Early Computer Cartography Project, Geography and Map Division, Library of Congress.
Then came computers. Initially, in the 1960s, most maps were still tied to paper because they had to be printed out to be viewed. But as memory increased, maps were finally freed from paper – the maps could be viewed and analyzed on screens.
Enter Roger Tomlinson, a British-trained geographer and geologist who worked for the Government of Canada and for an Ottowa-based aerial survey company. While working on a project to identify the best location for a tree plantation in Kenya, Tomlinson partnered with IBM to find a way to bridge the gap between geographic data and computer services. This initiative was eventually extended to create a national mapping system that created maps of Canada’s commercially-leveraged land used for agriculture, forestry, wildlife and recreation. It was during this project that Tomlinson created the term “Geographic Information Systems” to describe his synthesis of computer mapping with capabilities for overlay, measurement and digitizing.
2020 – GIS Today
On the basis of Tomlinson’s use of geographic location and computing power, a multi-billion dollar industry is now thriving and impacting almost every aspect of modern life. Nearly everyone in the world is now familiar with the Johns-Hopkins Covid-19 map that provides a stunning visual representation of real-time and historical data that shows where disease is most active. This map is based on Esri technology that was developed based on techniques that were created by Tomlinson. Jack Dangermond, founder and president of Esri, says that “Roger always makes me realize that GIS must first and foremost be focused on providing information that really matters (maps, reports, etc.) and that improves our sciences, processes and decision-making.”
The Future
The combination of increasingly “open” systems and software that has driven much of the explosive growth of GIS will continue. The visualization of real-time data in 3D, GIS-enabled augmented reality and virtual reality is already being used in many sectors -- creating immersive experiences that will expedite planning and coordination.
GIS will continue to drive adoption of the Internet of Things – more and more physical tools and objects will be connected and essentially duplicated in a digital environment.

RFID tags link to data in GIS - for easy updating in the field.
No matter how good digital reality becomes, its value is gauged by how well and accurately it reflects physical reality. For example, what is the value of a 3-D map that is used to guide workers to an underground gas valve – but the location in the map is wrong? That’s where connected marking makes all the difference.
Fortunately, technology is available that solves that issue. Berntsen has been working on this issue for nearly a decade and had developed a system that tags any type of asset (above or below ground) and ties its specific location to data in GIS. The InfraMarker system works with Esri’s ArcGIS Online to tie physical assets to their records in GIS.
This simple RFID technology ensures accuracy, enabling users to leverage the full power of GIS.
Today is GIS Day

That brings us to GIS Day, which is November 18 – when this amazing technology is celebrated – and shared with future surveyors, programmers, engineers, geographers – just about anyone interested in the science of our world.
Esri has a whole website that’s dedicated to GIS Day – I found this storymap particularly interesting and definitely worth sharing. Also, don’t miss the Library of Congress’s GIS Day on November 18th - Mapping the Pandemic.
Additionally, I personally found these maps worth a view:
Esri Covid Pulse for some scary truth
In the Shadow of a Volcano – Nice to see from a distance!
Salmon River’s South Fork – I want to visit this place!

NO MAN IS AN ISLAND - CELEBRATE GIS DAY!
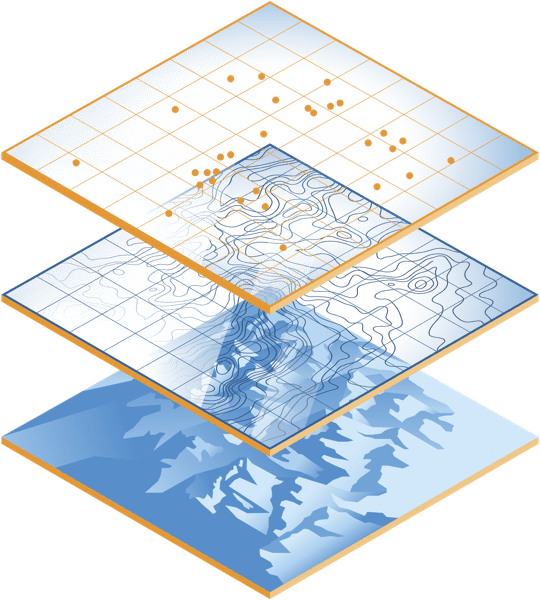
GIS means Geographic Information Systems – the technology that allows us to tell a story using data points on a map. Almost any kind of data can be added to a physical location to illustrate everything from rainfall amounts over time understanding patterns of human movement. With GIS, geography is no longer relegated to rooms filled with dusty maps.
John Donne got it right 400 years ago in an essay that includes this famous passage:

No man is an island,
entire of itself,
every man is a piece of the continent,
a part of the main.
Today, we can literally see the truth of what Donne wrote in 1623 . . . just look at The Human Reach Story Map created by Esri. Any view of the story map will illustrate the depth, beauty and power of our interconnectedness.
Today is GIS day.
GIS means Geographic Information Systems – the technology that allows us to tell a story using data points on a map. Almost any kind of data can be added to a physical location to illustrate everything from rainfall amounts over time understanding patterns of human movement. With GIS, geography is no longer relegated to rooms filled with dusty maps.
How it began
Hydrologic Unit Map from USGS
The concept of layering data over a map was first introduced by a German naturalist, Alexander von Humboldt. In 1817, he published the first isotherm map that showed the same average temperature over the globe. Before this map appeared, scientists had just assumed that average temperatures depended primarily on latitude. This map resulted in inquiries that led an understanding of how ocean currents, mountain ranges and other geography contribute to local climates.
In the 1960s, computers spurred the development of a new field of study – computational geography. In 1963, Roger Tomlinson was tasked with creating a manageable inventory of Canada’s natural resources. He realized his vision of using computers to store and process natural resource data with geographic data, and Geographic Information Systems was born. A year later, Harvard created the first computer mapping software, and in 1969, Jack and Laura Dangermond founded Environmental Systems Research Institute, Inc. (Esri).
Today, GIS gives us the tools to create our own digital maps to detect trends that can help solve problems.

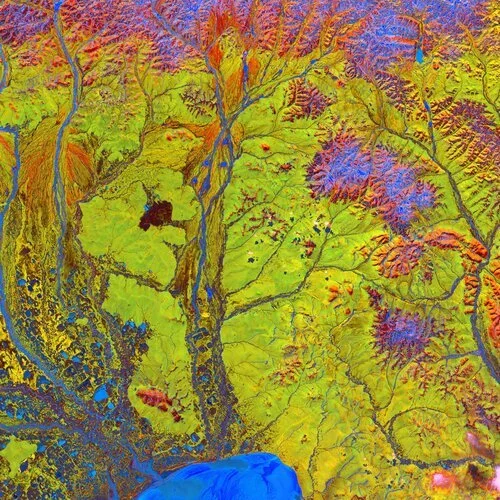
3D imaging of Kilahuea Volcano, USGS
3D imaging of Kilahuea Volcano, USGS
This technology is a revelation.
We can now see what has previously been hidden, figuratively and literally. From macro problems such as climate change to locating physical structures, GIS is becoming an essential tool.
For example, during excavation, a utility contractor wants to avoid disturbing buried assets such as gas lines, electrical, water or fiber lines. GIS, combined with location data from physical markers, can reveal what lays underground – before excavation begins. Any type of asset can be marked and mapped, becoming visible and verifiable before digging begins.
InfraMarker mobile app and data management software
How’s it done?
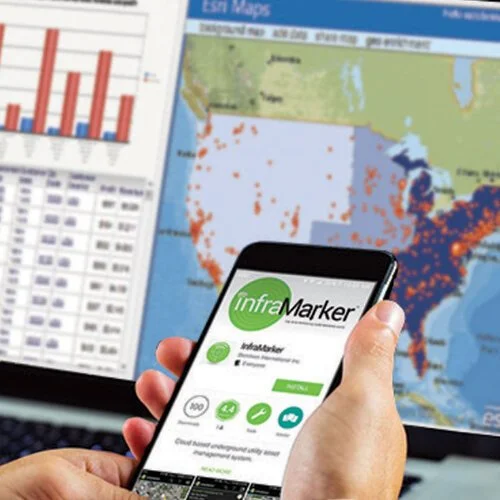
InfraMarker mobile app and data management software
Another common technology, Radio Frequency Identification (RFID) is combined with GIS to tag, identify and locate physical assets. It’s as simple as placing RFID markers on buried utilities, adding specific information about that location (a place where gas and fiber cross, for example) in a mobile app and then syncing that information with GIS.
This system, called InfraMarker®, was developed to help utilities accurately manage assets by pinning physical locations to virtually unlimited information. These pins contain specific, accurate location information that is linked to a wealth of data that is then displayed on a map – instantly viewable on a mobile app and in a GIS.
RFID markers are used in many industries for accurate tracking of inventory – and when combined with GIS, RFID provides true location intelligence – location verification and precision that can be used to improve operation workflows, reduce inspection reporting time and prevent excavation accidents. Utilities and other infrastructure owners now have a powerful, tool combines GIS accuracy with in-field location precision - making life easier for everyone dealing with infrastructure assets.
Enjoy GIS Day and imagine what GIS data could do for your utility mapping and management!

Installing InfraMarker Tags
InfraMarker is easy to install and manage. With lightweight and durable RFID tags, a RFID reader and a mobile phone, you have the power to track and locate any asset - either above or below ground.
Placement and writing of the InfraMarker tags
Process for installing, reading and Geo-mapping InfraMarker tags
Tag Install Preparation
Before you start, make sure you have access to the InfraMarker app on your mobile phone. Your employer will be able to give you access. Then, gather the InfraMarker tags needed for the project along with an approved RFID reader/writer.
Tag Placement
Visually confirm the asset point to be marked (a valve, stub, weld point, elbow, intersection, catch basin or other key feature).
For underground assets
Take a photo or video of the asset point while it is exposed in the hole. Please the tag above the point to be marked but below disturbance level. The tag is then covered with sand (recommended) or standard backfill.
Note: Tags in moist soil, clay or near other tags or metal should be placed as close to disturbance level as possible to maximize read performance. Optional Berntsen fiberglass posts are available to provide extra stability to the tag and to provide more precise direction from the tag to the underground asset.
For above ground assets
The technician takes a photo or video of the asset and attaches it to the asset record.
Tag Writing
Position the reader slightly above the tag (or the ground over the tag) and select the ‘write tag’ option on the app to begin the tag writing process.
Then, select the template type (above ground or in-ground) on the app. A series of choices will drop-down.
For example, the in-ground template displays the following fields:
Asset owner (e.g. utility company)
Asset type (e.g. gas, water, steam, fiber, cable, electric)
Asset material (e.g. In: PVC, steel; concrete, conduit)
Asset feature (e.g. weld, elbow, stub, intersection)
Depth from surface to asset (e.g. 4 ft surface to pipe)
Next, select whether the tag represents
an “InfraMarked” asset (located visually and marked with an InfraMarker tag),
an asset marked with an InfraMarker-enabled tag but not visually confirmed (usually with an InfraMarker-enabled above ground marker)
or an asset that is point identified but not marked or visually located.
Review the latitude and longitude coordinates of the tag location as displayed on satellite view of the map.
If the displayed lat-long pin corresponds to the tag location, confirm that the lat-long coordinates should be written to the tag.
If the coordinates are not available or incorrect, move the pin on the displayed map to the correct location and confirm the lat-long coordinates can be written to the tag.
If you know the precise lat-long coordinates based on prior survey, enter those coordinates on the map.
After data entry and GPS recording is complete, the full tag record is displayed you are prompted to ‘write data to tag? (Y/N)’.
Either confirm the data is correct or reenter tag data.
Write the data to the tag. The reader executes a ‘read’ operation and sends a confirmation message display of ‘write successful’ or ‘write unsuccessful.’
After placement and data entry, the field technician takes a short (up to 15 seconds) video of the surrounding terrain to provide a visual reference for the location of the tag and asset (e.g. “tag is in a right of way 60 feet to the eastern boundary of subdivision”; “tag now buried under paved road”). Once completed, the installer can attach the photo of the asset in the hole and a video to the data record.
Data uploading
Once the record is confirmed, all tag information including location video and comments, photo, date/time, user ID, mobile device ID, and tag EPC are stored as a data record and uploaded to the your GIS or the InfraMarker cloud as soon as an Internet connection is established.
Data access
An InfraMarker licensee can view the map of InfraMarker tags through the InfraMarker website or a mobile device. The level of data available for updating, viewing and download depends on the access level.