
It’s National Engineers Week!
Most engineers would argue that it’s always engineers week, but this week is the “official” week to highlight the stunning array of engineering accomplishments and types of engineering that make our lives easier in every way.
Most engineers would argue that it’s always engineers week, but this week is the “official” week to highlight the stunning array of engineering accomplishments and types of engineering that make our lives easier in every way.
The recent focus on infrastructure has helped bring engineering to the forefront. The tremendous work engineers have done to design and built our bridges, roads, airports is obvious for all to see. And everyone can see what happens when structures outlive their projected lifespan, not maintained properly or not replaced on schedule.

Dr. Snow’s waterworks map of 1846 from the UCLA Epidemiology John Snow Site.
However, many engineers are focused on the infrastructure we don’t see – the underground infrastructure, such as stormwater systems, buried telecom cables, gas and other buried pipelines. It’s a different world below ground where all these systems exist, conflict, age and require maintenance. In the past few years, enormous strides have been made to identify and map underground utilities and structures using new engineering approaches, as well as Geographic Information Systems (GIS).
GIS is a technology that uses maps to visualize data. GIS first appeared as a map created by Dr. John Snow in 1854. He plotted all the cholera outbreak locations in London, along with roads, property boundaries and water lines. His map revealed that cholera outbreaks were clustered around a water pump, challenging the existing notion that cholera was spread through the air. Along with creating one of the first uses of Geographic Information, Dr. Snow also is credited with starting the field of Epidemiology.
MAPPING + COMPUTERS
Mapping and analysis continued to be done on paper until the 1960s. Then, along came Roger. Roger Tomlinson was a British-trained geographer and geologist who worked for the Government of Canada and for an Ottowa-based aerial survey company. He figured out a way to computerize the process. While working on a project to identify the best location for a tree plantation in Kenya, Tomlinson partnered with IBM to find a way to bridge the gap between geographic data and computer services. This initiative was eventually extended to create a national mapping system that created maps of Canada’s commercially-leveraged land used for agriculture, forestry, wildlife and recreation. It was during this project that Tomlinson created the term “Geographic Information Systems” to describe his synthesis of computer mapping with capabilities for overlay, measurement, and digitizing.
SMART CITIES

Today, GIS, ground-penetrating radar and other emerging technologies are helping utilities and cities build a digital map that captures the exact location of utilities. This is a major part of any “Smart City” initiative.
Unfortunately, a disconnect between the real world and the digital world persists, despite all the technology. For example, a growing number of municipalities are using GIS systems to manage the inspection and maintenance of various types of utilities, including stormwater assets. The stormwater manager will use the GIS to schedule inspections, assuming that the data in the GIS is accurate. When the field crew arrives at the scheduled location, they often discover that the data in the GIS simply doesn’t match what they actually see when they arrive. The assets may not be where they are supposed to be, including above-ground assets such as manholes and catch basins. This confusion and uncertainty waste a lot of time which can leading to errors.
CONNECTED RFID

InfraMarker Connected RFID
Fortunately, there is now a technological solution that ties the digital world directly to the real world using RFID, the fastest-growing asset ID technology in the world. Engineers at Berntsen International leverage both GIS and RFID to create a simple approach to resolve the digital/reality disconnect. RFID tags, each with its unique ID, are placed on any type of asset. Then the asset ID is connected to its specific record in GIS. A quick scan of the asset will load any applicable forms for the field staff to fill out. This connection means that assets (even underground assets) are correctly identified, and the record is accessible where it counts – in the field for updating and in the office for scheduling.
This simple approach, called InfraMarker Connected RFID, has broad implications for infrastructure asset management. It improves asset locating and identification, speeds inspection and maintenance workflows, reduces errors and supports compliance requirements.
Additionally, Connected RFID provides an important safety mechanism for the management of buried assets. Everyone has seen news stories about gas lines, telecom cables or water mains being accidentally struck during construction. Sometimes these accidents involve injury and/or loss of life, and they almost always result in property damage and loss of service. In 2019, an estimate of the annual societal costs from damages to buried utilities was approximately $30 billion.
If buried assets were marked with RFID, they could be quickly located and identified with a simple RFID scan. Important information about other nearby buried utilities can be easily added to an asset record in GIS, making that information accessible and shareable across utilities.
Thanks to engineers, this technology is available today, making infrastructure asset management more efficient, more useable, and safer.

Blossoming Blooms
Harmful algae blooms (HABs) are occurring more and more frequently in lakes, rivers, streams and coastal areas across the United States. Further, HABs are occurring where they were never found in the past. View a map from the Natural Resources Defense Council that tracks HABs across the United States.
CONTAINING THE THREAT OF HARMFUL ALGAL BLOOMS (HABS) IN URBAN ENVIRONMENTS
Harmful algae blooms (HABs) are occurring more and more frequently in lakes, rivers, streams and coastal areas across the United States. Further, HABs are occurring where they were never found in the past. View a map from the Natural Resources Defense Council that tracks HABs across the United States.
The chart below tracks the number of reports of algal blooms over time up to October 2021.
NUMBER OF HARMFUL ALGAL BLOOMS IN THE U.S. BY YEAR

WHAT IS A HARMFUL ALGAL BLOOM?
An algal bloom is an overgrowth of microscopic algae or algae-like bacteria in fresh, salt or brackish water. Many type of algae or bacteria can produce algal blooms; not all are toxic and not all are harmful. Less than one percent of algal blooms produce toxins; harmful algal blooms (HABs) are those that have negative impacts on humans, marine and freshwater environments and coastal areas.
The most common types of harmful freshwater algal blooms are caused by cyanobacteria. Some types of cyanobacteria can produce dangerous cyanotoxins. Some of these cyanotoxins can attack the liver, kidneys, central nervous systems, skin and lungs, resulting in serious damage or even death.
WHAT CAUSES HARMFUL ALGAL BLOOMS?
HABs can occur naturally, but the increasing prevalence and frequency is caused by:
Nutrient pollution, such as agricultural runoff, wastewater and stormwater runoff (which is increasing due to more frequent severe rainfall events).
Warmer temperatures.
Still water, such as in dams, canals and other man-made waterways.
STORMWATER MANAGEMENT – THE FIRST LINE OF DEFENSE AGAINST HABS
HABs have a significant, yet largely unmeasured economic impact. Looking at just the recreation and tourism industry, a single harmful algal bloom event in a lake in Ohio cost $37-$47 million in lost tourist revenue over two years.*

The reduction of nutrient pollution is the most accessible and effective method of reducing algal blooms in urban areas. It is estimated that 10 trillion gallons of untreated stormwater now flow into our lakes, rivers, streams and coastal areas.
Many municipalities are implementing asset management programs (AMPs) to help quantify and manage their stormwater infrastructure. Because infrastructure was built over a long period of time, it’s likely that documentation fragmented and inaccurate, which makes efficient maintenance very difficult. Actually knowing the location and condition of infrastructure assets goes a long way in creating a proactive plan to inspect, manage and repair existing assets.
SMALL INVESTMENTS IN PROVEN TECHNOLOGY CAN MAKE A BIG DIFFERENCE

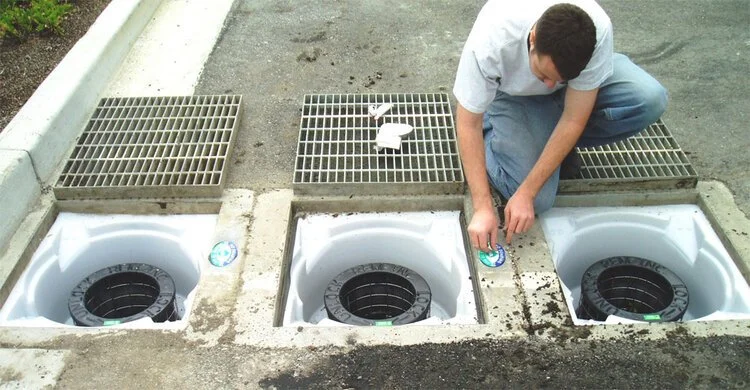
Reading an RFID marker on a catch basin.
Fortunately, cost-effective technology is available to help make efficient asset management available to municipalities. Rather than keeping track of stormwater assets on paper and then digitizing the information, many municipalities have gone digital, using Geographic Information Systems (GIS) to keep track of their catch basins, swales, hydrants and other assets. However, in many cases, even if all the assets are viewable on a GIS system, truly useful data is not.
For example, a single intersection may have literally dozens of manholes, storm drains, catch basins, hydrants and other assets that require regular inspection and maintenance. GIS systems don’t have a way to identify discrete assets in close proximity. That’s where the InfraMarker system comes in. It offers a way to link verified physical location with the digital world using simple, proven technology.
Any asset that is marked with a RFID tag can be linked to unlimited asset information in a GIS using a simple mobile app. Field technicians can verify with certainty where they’re at and then link their maintenance activity with that specific asset – no guesswork or wasted time involved.
Asset managers benefit because they can view all assets online and delve into each specific record to view videos, photos and any other documentation the field tech has attached to the specific tag. An audit trail has been created so asset managers can schedule inspections and maintenance knowing that there will be no confusion or wasted time in the field dealing.
*Estimated Annual Ecomonic Impacts from Harmful Algal Booms (HABs) in the United States, WHOI-2000-11.

It’s GIS Day!
Most people don’t really think about how geographic information provides the framework for our entire existence. We exist as living organisms in time and space. Our minds may be occupied with far-way thoughts, but our memories are inextricably tied to the place where they were created. As long as we live and breathe, we always have a location.
Blog by Emily Pierce, PLS, CFedS

Most people don’t really think about how geographic information provides the framework for our entire existence. We exist as living organisms in time and space. Our minds may be occupied with far-way thoughts, but our memories are inextricably tied to the place where they were created. As long as we live and breathe, we always have a location. Shakespeare’s Hamlet said “To be or not to be, that is the question.” Surveyors say, “To be is to occupy a position relative to two axes.”
Surveyors are trained to understand the implications of geography and location differently than most people. Precision is applied to location and this information has been the basis for civilizations for thousands of years. I’ve written about ancient surveying instruments in previous blogs: Ancient Egyptian Surveying and Ancient Roman Surveying.
Today, geographic information is more important than ever and is being used in ways that were previously unimaginable. As a surveyor, I had the opportunity to work with Geographic Information Systems (GIS) early on, mainly by being the boots on the ground that provided accurate geographic data that was subsequently used in GIS. We provided accurate survey-grade locations on US Public Land Survey corners (section and quarter-section corners) to be utilized into a county tax parcel database. This not only helped improve how the county taxed its citizens, it also helped citizens with land development, taking into account appropriate building sites, flood zones, wetland preservation, general zoning requirements, just to name a few. Beyond that, the GIS also is used for school and voting districts, changes in municipal boundaries and incorporations, addressing, and emergency response management.
Nothing stays the dame
Change has accelerated quickly in the years since I started working with GIS, as evidenced by a 2009 article entitled the “Top Five Benefits of GIS”, with number one benefit being cost savings from greater efficiency using location-based data.
The example cited was Sears, which was able to use GIS to reduce the time it took for dispatchers to create routes for their home delivery trucks by 75%. I’m sure that was a huge savings, but unfortunately for Sears, Amazon was already taking over on every front. By 2021, the Sears footprint had shrunk from 3,862 stores in 2009 to just 19 stores and a website.
Route optimization is only one of the thousands of applications of GIS technology. From precision farming to spatial econometrics (the intersection of spatial analysis with economics) to creating ultra-precise road maps to facilitate autonomous vehicles. Check out the 1,000 Uses of GIS for a glimpse into the future.
When researching this blog, I learned about a project where Toyota is using a platform that gathers crowd-sourced data from vehicle cameras and combines it with high-precision GPS and GIS to create precise and up-to-date road information. This information will be used for autonomous driving in the future, or probably already is!
What?!
Interestingly, a whole new industry is being created around monetizing the vast amount of data that is generated from vehicles. McKinsey estimates the market for this information might add up to $450-650 billion by 2030. I wish there was some way I could get a cut of these billions!
You may not even realize that the navigation systems in your vehicles are GIS. I’m partial to the Waze app. I love how they incorporate real-time data on reported crashes, speed traps and even roadkill, (important to know, because we have lots of moose and deer up here)! All this can be narrated by people from Dexter on Showtime to PAW Patrol on Nickelodeon.
Other GIS uses

Pretty much everyone knows about the Johns-Hopkins COVID map but did you know that there’s a HealthMap that maps reports the location of all kinds of diseases? For example, in the past month, Legionnaires’ Disease was found in three locations in the U.S. Definitely worth looking at before traveling. NASA is also providing satellite data to cancer researchers to help pinpoint the types of human activity that lead to cancer in geographic areas. The Landsat Program is the longest continuous space-based record of Earth’s land in existence.
As you know, I’m a history buff, and I really like the ArcGIS Online Historical Maps. It makes all the USGS topographical maps accessible. All you need to do is find a place, and any maps that USGS has on it over time will be available. I just downloaded this map form 1890 of New Orleans.
I could go on and on, but I invite you to check out the many ways GIS is being used today.
I know in the past, many surveyors thought that GIS was going to obsolete the profession, but that is definitely not the case. We still need boots in the field tying the data in digital maps to real places in the real world. I’m personally involved in introducing a product that does just that, using RFID to literally tie the physical to the digital. Check it out at inframarker.com. It’s a great product with as many applications as GIS itself.
Emily Pierce is a surveyor and Berntsen’s Business Development Manager. Learn more - email: info@inframarker.com

811 - CALLING IS A MUST, BUT NOT ENOUGH
A week ago today, National 811 Day was commemorated. It’s a national awareness campaign to highlight the need to call 811 before digging – in our yards or at a construction site. Many organizations in charge of utility assets use this day to promote the importance of calling 811 BEFORE digging. For example, The Southern Gas Company did this great “No Diggity” video to help promote awareness.
A Blog by Emily Pierce, PLS, CFedS
There’s a better way.

A week ago today, National 811 Day was commemorated. This means a lot to me because I know first hand how important it is that people make the 811 call before digging. But I also know that there is a lot more to underground safety than more 811 calls. We need better methods for identifying and validating what is underground.
According to the Pipeline and Hazardous Materials Safety Administration (PHMSA), ruptured gas distribution systems have killed an annual average of 10 people and injured an average of 46 more.[i] Excavation damage has almost always been the cause of ruptures that resulted in fatality, an injury requiring in-patient treatment, or damages more than $50,000.
For firms that are excavating every day, the need to “Know what’s below” is essential for safe operations.

The latest DIRT Report (Damage Information Reporting Tool) shows that damages caused by underground utility strikes are increasing for the fifth consecutive year. In 2019, the cost of this damage was estimated at $30 billion. The most common cause listed for these utility strikes was “failure to notify”, meaning no one called 811 before excavation. But other causes, such as excavation issues and locating issues are also leading causes for damage.
The truth is that we don’t really know how much damage is done by excavation errors. In many sectors, there are no legal requirements for reporting utility strikes. Although a growing number of companies are voluntarily reporting, the data provides a very incomplete picture.

The National Society of Professional Surveyors (NSPS) is working to raise the visibility of the need for accurate geospatial data for infrastructure projects that include transportation, energy, communications, water supply, and other systems. NSPS is one of the thirteen members of the Coalition of Geospatial Organizations (COGO) that seek to speak with one voice on geospatial data and policy issues. This group provides input to the Federal Geographic Data Committee that has developed a National Spatial Data Infrastructure Strategic (NSDI) Plan.
These groups were heavily involved in the Infrastructure Bill working its way through our federal legislative process. They are working to ensure that the federal investment in infrastructure improvements include geospatial data components to increase accuracy and precision in our infrastructure investments, like transportation, high-speed internet, power and gas utilities, rails, and clean water.
Trends toward the adoption of new technologies that help create accurate data to help us “Know what’s below” are strengthening. I know that surveyors are embracing new technologies to that help create underground surveys. Along with GIS, LiDAR and GPR, other tools are making the job of underground surveying much easier.
There’s a better way - connected RFID
For example, over the past year, I’ve been working with a number of utilities who are using Connected RFID to track and manage infrastructure assets. RFID is a key technology that enables direct connection between the real world and the geospatial world.
One of the most persistent and thorniest problems of any kind of geospatial data is accuracy. If the data isn’t spatially accurate, then its usefulness is massively reduced. I know I’m preaching to the choir. We surveyors spend our lives creating and correcting geospatial data and understand the importance of accuracy.
A direct connection between an infrastructure asset and its data is of tremendous value, and that’s exactly what InfraMarker RFID does. It’s pretty simple – an RFID tag is affixed to an asset (above or below ground). Each RFID tag has a unique ID that is linked to that asset’s record in the GIS system using software on a mobile device. Once linked, a field technician can scan a tag and automatically load that asset’s specific record for updating. No need for a line of sight with RFID, so this makes InfraMarker perfect for underground utilities.
More and more, gas, water and telecom utilities are adding InfraMarker RFID to enhance the accuracy of their geospatial data and make life easier for field technicians. As a surveyor, think of how much easier our jobs would be if we could actually scan buried markers and have them identify themselves . . . or use the RFID scanner to identify nearby buried utilities.
The advantage of InfraMarker is the accuracy it delivers to help utilities better manage their infrastructure assets. A value-add is that this data could also help prevent excavation strikes, helping everyone “Know what’s below”.
While we know that 811 has some inefficiencies, it is the best first line of defense for damage prevention for a property owner and the utility. Without proper locating subsurface utilities before excavation, the results can be costly.
Interested? Contact me for more info - info@inframarker.com
[i] https://thestoddardfirm.com/premises-liability/construction-accident-injuries/gas-line/

A DAM-AGING STORMWATER REPORT CARD FROM ASCE
Urban flooding results in more then $9 billion in damages annually, while federal funding to support stormwater maintenance/upgrades averages about $250 million annually. It’s not surprising that stormwater infrastructure is in bad shape and has earned a grade of “D” from the ASCE.
Blog by Tom Hershberger, MS, MBA
Infrastructure is a hot topic now, and it’s long overdue for more than just discussion during National Infrastructure Week.
The American Society of Civil Engineers (ASCE) have been focused on this topic since 1988, producing a regular report card for US infrastructure. At first, there were 12 categories, and with this year’s addition of Stormwater, there are 18 categories.
Urban flooding is problem #1
Urban flooding results in more then $9 billion in damages annually, while federal funding to support stormwater maintenance/upgrades averages about $250 million annually. It’s not surprising that stormwater infrastructure is in bad shape and has earned a grade of “D” from the ASCE.
Stormwater runoff is defined as rain or snowmelt that travels over impervious surfaces or cultivated areas, then is collected and drained into streams, rivers, lakes, bays or oceans. These systems of stormwater conveyance take many forms, from canals, to sewers, detention ponds and constructed wetlands.
In the US, there are approximately:
3.5 million miles of storm sewers
270 million storm drains
2.5 million stormwater treatment assets
Stormwater systems are a mix of publicly-owned (by local, state and the federal government) and privately-owned assets. The EPA is tasked with regulating all of this, but their focus has primarily been on Municipal Separate Storm Sewer Systems, known as MS4s. Because of this, most municipalities have an asset management / maintenance program.
On the other hand, corporate property owners or homeowners associations are not routinely monitored, which leads to deferred maintenance and increases the likelihood of urban flooding and increases the threat of pollution from runoff.
Stormwater conveyance systems have a lifespan of 50-100 years (depending on what materials were used in the original construction, such as reinforced concrete, corrugated metal or PVC). Because most stormwater systems are paid for by local fees or taxes, that often means that maintenance and/or replacement have been postponed, leaving many communities with dangerously outdated stormwater infrastructure.
Even in communities where stormwater systems were constructed more recently (within the past 30 years), it’s likely that they weren’t designed for today’s capacity needs, especially with the growing frequency of high-precipitation events.
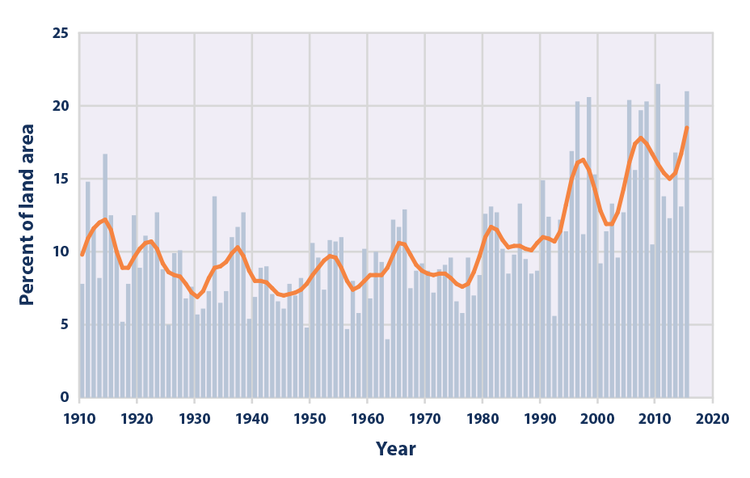
This figure shows the percentage of the land area of the contiguous 48 states where a much greater than normal portion of total annual precipitation has come from extreme single-day precipitation events. The bars represent individual years, while the line is a nine-year weighted average.
Beyond flood mitigation
Stormwater runoff causes lots of problems besides flooding. Every year, an estimated 57 million Americans are sickened by contaminated water in recreational areas. An 2019 analysis of fecal indicator bacteria sampling data from beaches in 29 coastal and Great Lakes states and Puerto Rico, reveals that 386 beaches – nearly one of every eight surveyed – had potentially unsafe levels of pollution on at least 25 percent of the days that sampling took place that year.
Additionally, other types of pollutants flow into our waterways when stormwater is not controlled. For example, the quantity of used oil from a single oil change can pollute up to one million gallons of fresh water. Then there’s all the litter, construction debris, fertilizer, pesticides, road salt, pet waste, etc., that regularly flows into storm sewers. In an up-to-date stormwater system, these pollutants can flow into swayles, rain gardens where they can be held and filtered, instead of flowing directly into a stream, lake or ocean.
It’s vitally important that these systems are brought up-to-date.
Learning to make the most of what we have
Additional money for infrastructure may be on its way, but in the meantime, many municipalities and stormwater management organizations are already executing a plan to be compliant with EPA regulations and plan for the future.
The recommended first step toward improving a stormwater system is to have a comprehensive understanding of the location and condition of all existing stormwater assets. This can be very challenging because oftentimes in municipalities, these records are kept in different departments, housed in different databases or even kept in paper files.
Fortunately, technology can really help with this issue. Geographic Information Systems (GIS) are increasingly being used to manage all types of municipal activities. GIS location-based information is extremely useful in managing stormwater assets spread across a specific geographic area. Today, municipalities are busy creating a digital twin of their existing city, which is a great concept that has real-world benefits but also faces real-world disconnects.

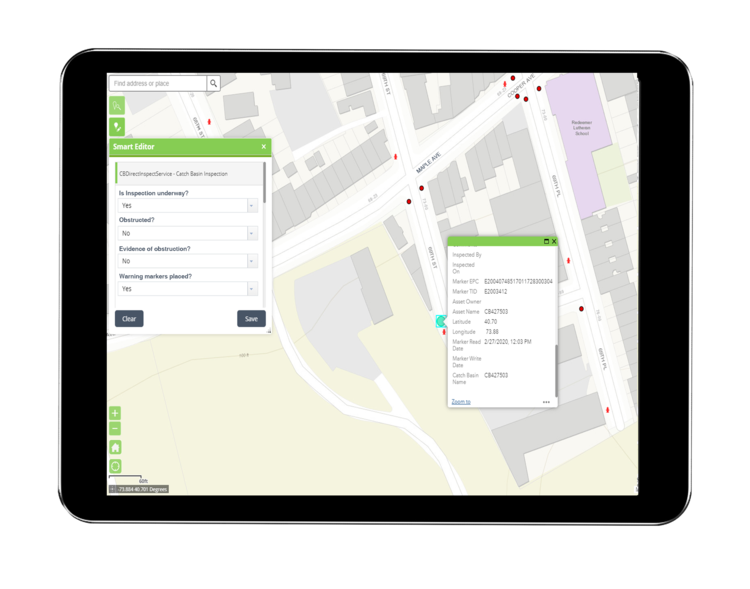
Example images from a geographic information system (GIS) illustrating storm-sewer infrastructure.
One very common disconnect is that the assets a digital map displays are not what maintenance workers find when they come to a job site. For example, they may be tasked to perform an inspection or maintenance on a catch basin located on a specific intersection. They use the GPS to guide them to that location. Upon arrival, they see not one, but four or even eight catch basins in that area. So they have to invest time in working with the office to identify the right basin, or they just pick one and hope it’s the right one.
Unfortunately, guesswork is what the GIS digital twin was supposed to eliminate.
There’s a simple solution that can permanently resolve that issue, while simplifying field documentation. It involves marking assets with an RFID tag, then connecting those tags to their records in the GIS using a standard mobile device.
InfraMarker connected RFID makes all the difference
When marked with RFID tags, field workers no longer need to guess which asset to work on. They can simply have assets identify themselves with a quick read of the RFID tag. Once they identify the asset they need to work on, the right form will pop up and they can complete the work and move on.
InfraMarker RFID-enabled markers directly connect the physical and digital worlds in a way that delivers fast, accurate and auditable asset management. This approach fits into existing field workflows while leveraging existing GIS/Asset Management platforms. InfraMarker connects specific infrastructure assets to their unique digital records, providing accurate, auditable and actionable data to asset managers, often in real time.
RFID-enabled asset management not only ensures that the digital twin is accurate, it generates an audit trail that meets the EPA regulations for compliance.
This simple solution is now being used for all kinds of infrastructure assets across the country, including municipal stormwater assets.
See a quick video of how InfraMarker Connected RFID works to mark and manage stormwater assets here.
To learn more, contact us!.

INFRAMARKER BY BERNTSEN AWARDED THE ESRI RELEASE READY SPECIALTY DESIGNATION
Berntsen International, the leader in infrastructure marking solutions, announces that it has earned the Esri Release Ready Specialty status. This designation recognizes companies, products and solutions that integrate with Esri technology and are created by partners with expertise in leveraging Esri solutions and software.

MADISON, Wisc. March 24, 2021 - Berntsen International, the leader in infrastructure marking solutions, announces that it has earned the Esri Release Ready Specialty status. This designation recognizes companies, products and solutions that integrate with Esri technology and are created by partners with expertise in leveraging Esri solutions and software.
InfraMarker®, a division of Berntsen International, is the leader in connected RFID-enabled infrastructure asset management. The full InfraMarker line includes rugged RFID-enabled marking products, RFID readers and accessories designed for exceptional field performance, and RFID-connecting software enhancements that leverage Esri’s data collection capab. The InfraMarker approach delivers an essential connected solution for AEC firms, utilities, municipalities and other organizations that design and manage infrastructure assets.
The InfraMarker Web Widget for ArcGIS Web AppBuilder is the latest in InfraMarker’s connected RFID software line. Field personnel using the InfraMarker Web Widget with a web app simply scan an asset RFID tag to confirm the asset ID. The asset’s specific records or inspection forms will automatically launch from the organization’s platform. The process reduces time, cost, and errors while improving compliance controls.

“The InfraMarker Web Widget for ArcGIS Online is a perfect example of the innovation Esri helps make possible,” said Frank Martin, Esri Partner Manager. “This solution enables clients to streamline field asset management while creating accurate, auditable records in ArcGIS Online. InfraMarker provides a simple solution to data collection and compliance issues faced by a range of industries.”
Benefits of the InfraMarker enabled solution:
Simple, Unified Approach – InfraMarker simplifies the asset identification and data collection process in the field. The Web Widget is customizable using ArcGIS Web AppBuilder and easily integrates with ArcGIS Online. Field users can quickly access asset data, maps, files (including images and video) and transmit verified asset data in real-time from the field to the office, enabling up-to-date, accurate asset management.
Scalability and Flexibility – The InfraMarker RFID Solution can mark and manage any asset – above or below ground. RFID tags are incorporated into utility posts, affixed directly on infrastructure assets, or placed underground to identify pipelines, telecom, electric – any asset that needs to be located or tracked.
Improved ROI in the field – InfraMarker eliminates the guesswork involved in identifying specific assets and accessing the correct forms. A simple date/time stamped RFID scan activates an asset’s data record and presents the correct associated record or data collection form on the user’s mobile device. This streamlines operations while enhancing accuracy and providing an audit trail.
“We’re pleased to offer the InfraMarker RFID Web Widget to Esri’s ArcGIS clients,” said Mike Klonsinski, Berntsen International president. “The offering is another advancement in our commitment to enabling a smarter infrastructure world.”
About Berntsen International, Inc. and it’s InfraMarker solution
As an infrastructure marking company founded in 1972, Berntsen has been developing smart marking products for more than a decade. Its patented InfraMarker RFID solution combines the durability and precision of Berntsen marking products with a unique application of RFID technology specifically developed to connect physical markers with digital records. Berntsen has been an Esri Silver Partner for more than 10 years.
About ESRI
Esri, the global market leader in geographic information system (GIS) software, location intelligence, and mapping, helps customers unlock the full potential of data to improve operational and business results. Founded in 1969 in Redlands, California, USA, Esri software is deployed in more than 350,000 organizations globally and in over 200,000 institutions in the Americas, Asia and the Pacific, Europe, Africa, and the Middle East, including Fortune 500 companies, government agencies, nonprofits, and universities. Esri has regional offices, international distributors, and partners providing local support in over 100 countries on six continents. With its pioneering commitment to geospatial information technology, Esri engineers the most innovative solutions for digital transformation, the Internet of Things (IoT), and advanced analytics.
Visit us at esri.com.