
Key Trends in 2024
The “Fourth Industrial Revolution” is well underway. Back in 2011, economist Klaus Schwab coined the term to refer to the rapid digitization and accessibility of technologies that spark a global shift in processes – in everything from how we communicate to how businesses and governments are managed.

The “Fourth Industrial Revolution” is well underway. Back in 2011, economist Klaus Schwab coined the term to refer to the rapid digitization and accessibility of technologies that spark a global shift in processes – in everything from how we communicate to how businesses and governments are managed[1].


Drone image by Florian Pircher from Pixabay

Building information model of a mechanical room developed from lidar data (image provided by Yelda Turkan, OSU College of Engineering).
More a decade later, this revolution is accelerating, driven by the widespread use of cloud computing, “big data”, virtual reality and artificial intelligence (AI). These “disruptive technologies[2]” are fundamentally changing our lives and how we do our jobs. All industries, including surveying and civil engineering, are leveraging these new technologies to automate tasks, increase precision and generate more useful data.
Integration of 3D Laser Scanning Technology (LiDAR)
3D laser scanning traces back to the early 1960s when researchers experimented with laser technology to measure distances and create 3D representations of objects. The first practical applications of laser scanning emerged in the 1970s, in the field of surveying and topographic mapping. However, 3D laser scanning didn’t become useful until advancements in computing power and data processing capabilities were integrated with portable scanning technology. Today, surveyors can combine 3D scanners with their total stations to measure distances and create accurate three-dimensional representations of the surveyed area. The use of 3D laser scanning enhances data collection speed, accuracy, and enables more comprehensive visualization and analysis[3]. Berntsen offers a line of laser targets designed to work with these advanced systems – enhancing accuracy and ensuring repeatability.Drones
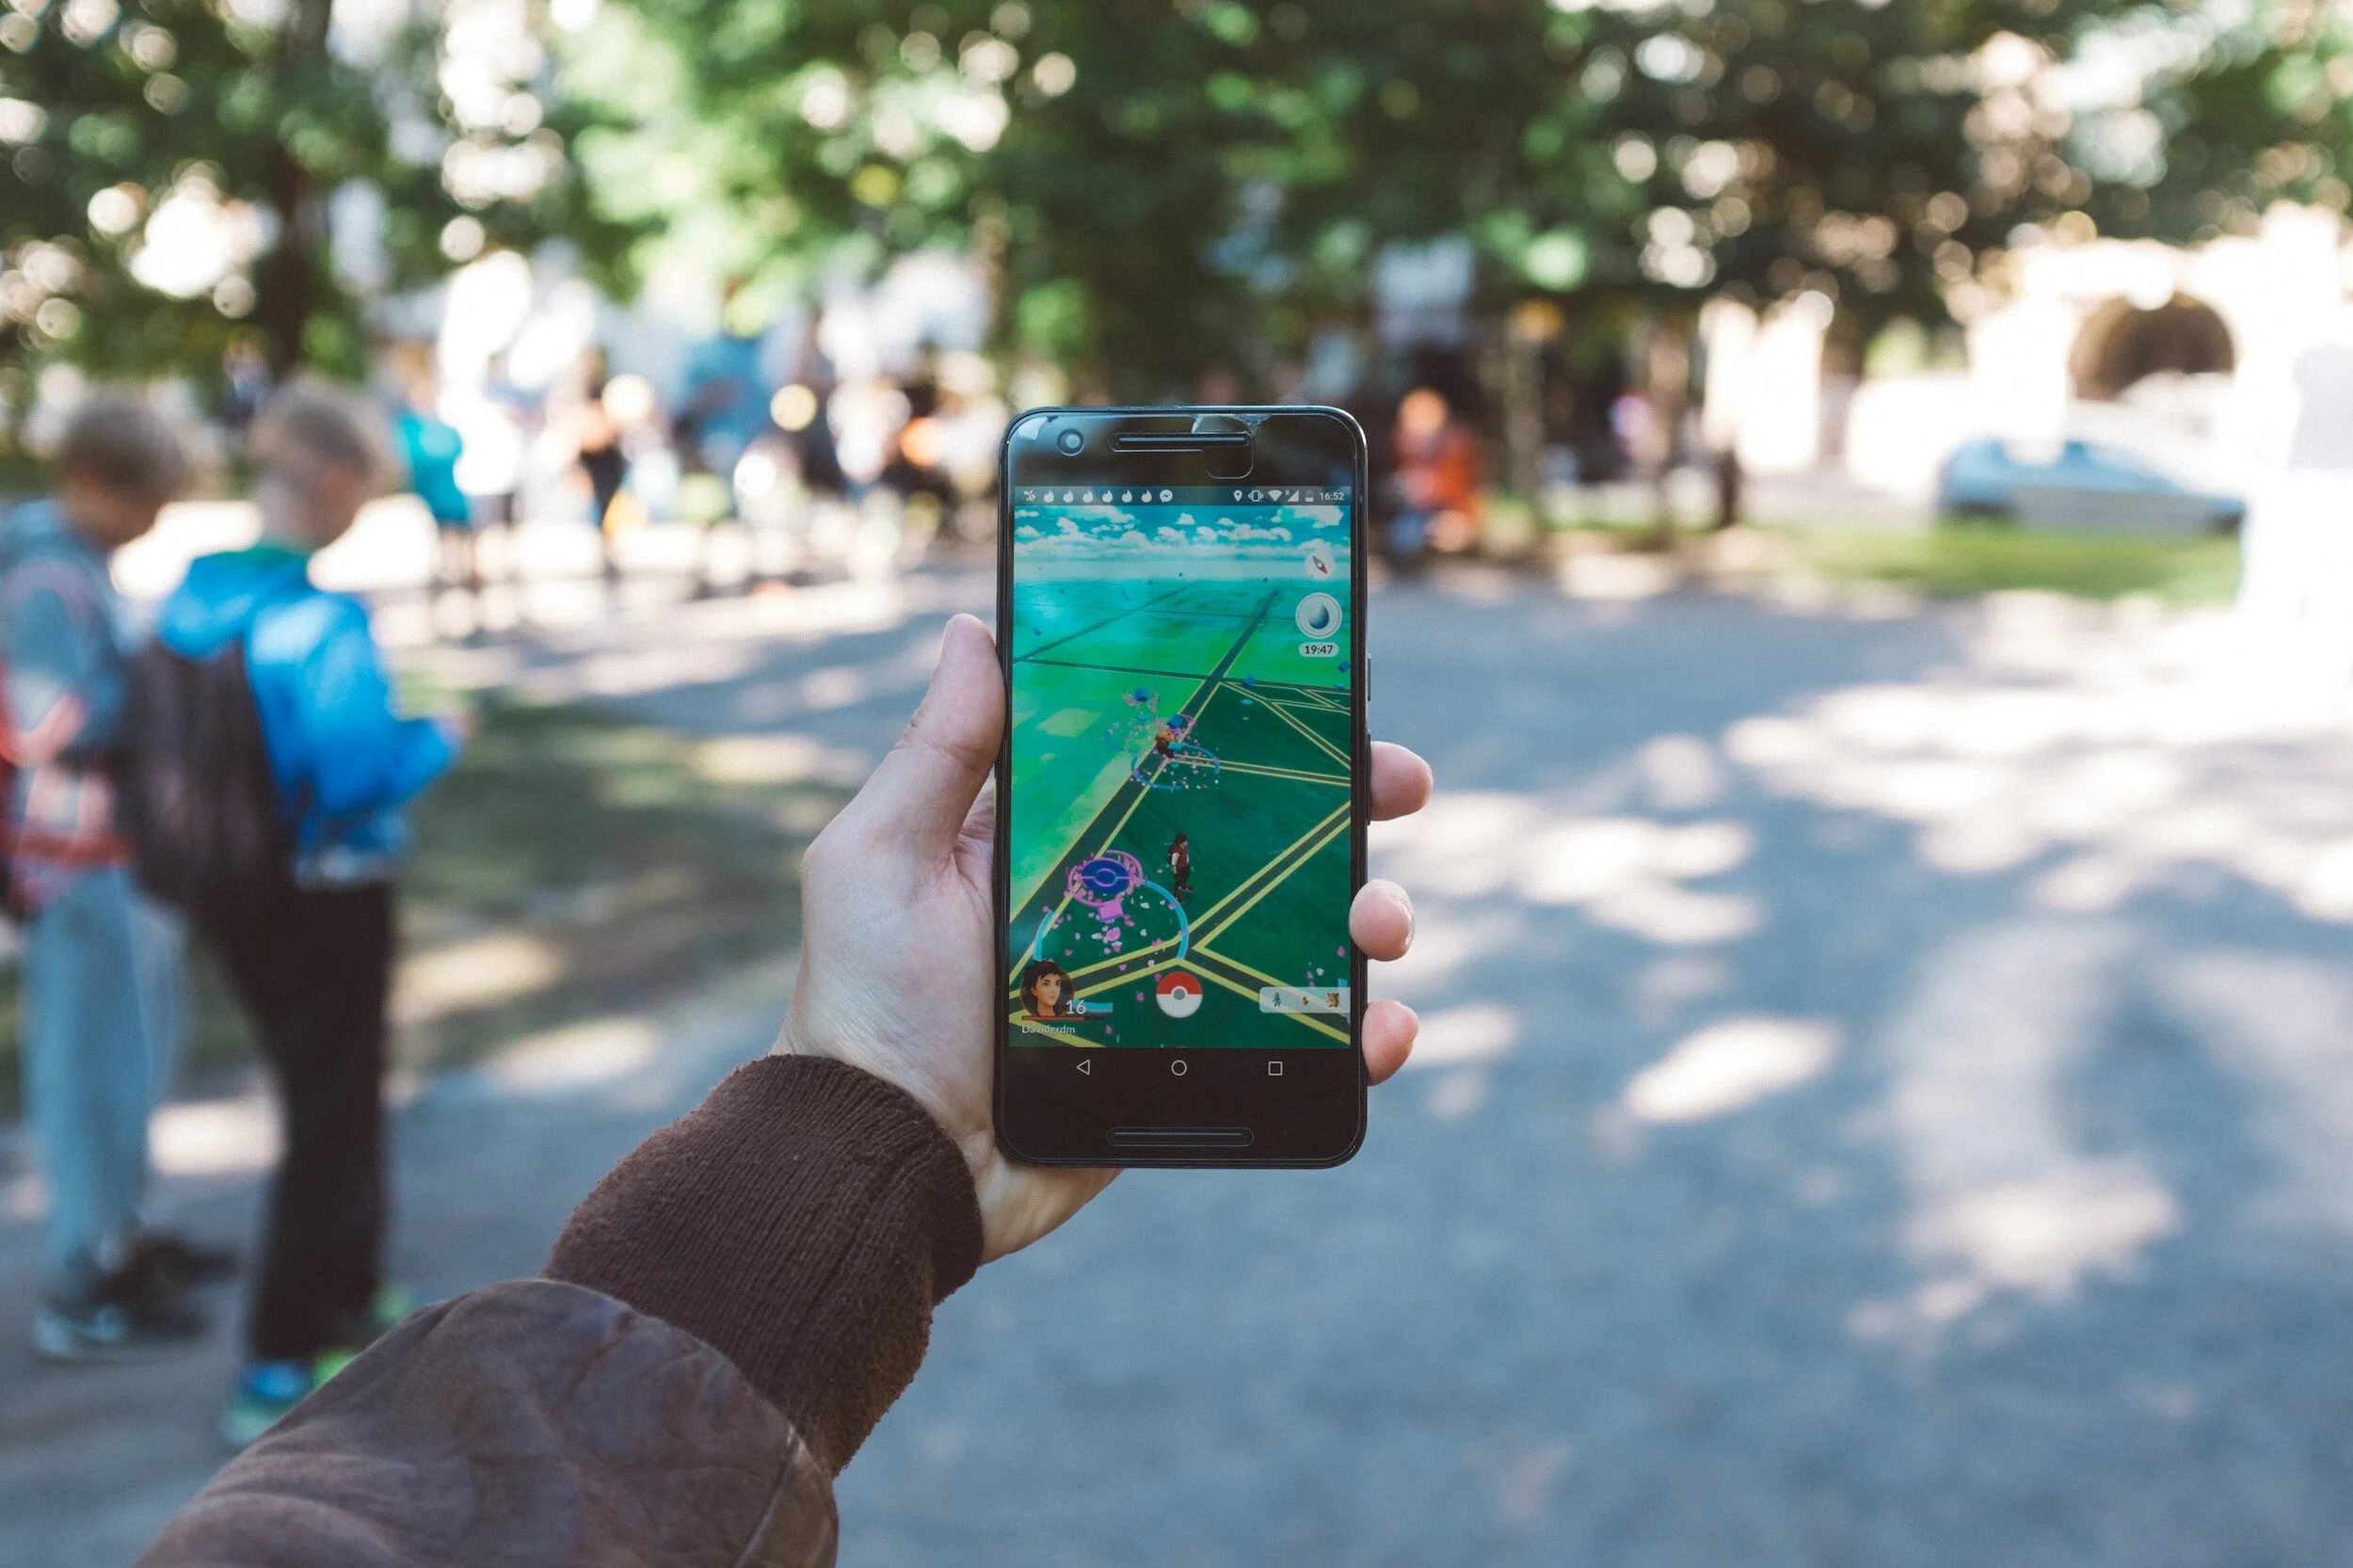
Drones equipped with high-resolution cameras and LiDAR sensors capture imagery and terrain data, allowing surveyors to obtain valuable insights for mapping, topographic surveys, and volumetric calculations. This technology makes it possible to survey inaccessible areas, reducing field time and increasing the efficiency of data collection and processing[3]. Of course, having accurate reference points is key to successful aerial surveying – see how Berntsen’s drone targets can work for you.Building Information Modeling (BIM)
BIM uses a range of technologies to create a digital representation of a structure or infrastructure project, integrating survey data with architectural, engineering, and construction information. Surveyors contribute crucial geospatial data to BIM models, facilitating clash detection, accurate quantity take-offs, and construction coordination. BIM enhances collaboration among project stakeholders, reduces errors, and enhances overall project efficiency[3]. Berntsen helps surveyors ensure BIM data precision with its line of smart targets and reflectors.
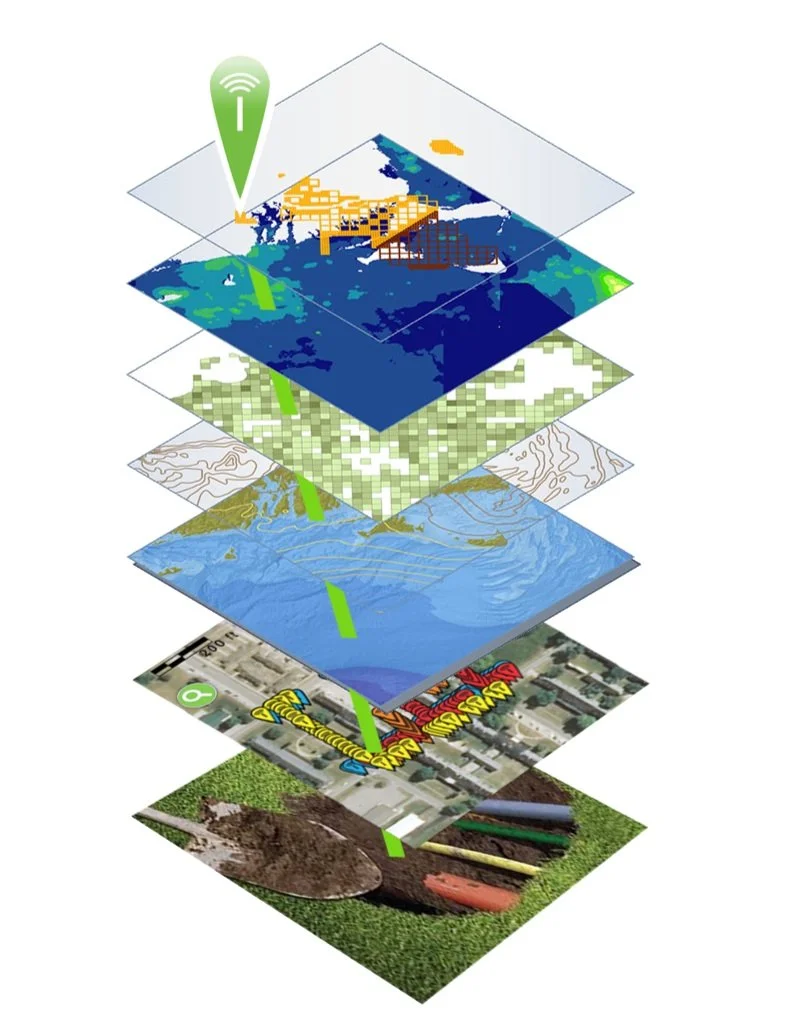
Layers in Geographic Information Systems, augmented with RFID
Augmented Reality (AR) and Virtual Reality (VR) Applications
Augmented Reality (AR) and Virtual Reality (VR) technologies are finding their way into land surveying practices, offering immersive experiences and enhanced visualization. AR and VR applications enable surveyors to overlay survey data onto the real world or create virtual environments for project planning and simulation. These technologies aid in communication, decision-making, and public engagement, providing stakeholders with a better understanding of the surveyed area and proposed designs[3]. These visualizations are extremely precise when surveying measurements include the use of high-quality prisms that help ensure accuracy – available from Berntsen.Geographic Information Systems (GIS)
Cloud-based Geographic Information Systems provide centralized storage, access, and analysis of map-based survey data. GIS is another technology that was first developed in the 1960s using existing spatial analysis and visualization methods, combined with computing power, to identify and manage land characteristics and use over large areas. Soon the usefulness of a spatially based approach to data visualization and analysis was applied to a vast range of functions. Today, GIS is becoming more and more powerful through the integration of other technologies, including Radio Frequency Identification (RFID) and AI.
Radio Frequency Identification (RFID)
As data visualization gets better and better, it becomes increasingly important to ensure that the data itself is precise. That’s where RFID comes in. RFID literally ties the physical to the digital, authenticating any marked asset at its physical location. An RFID tag, placed on anything anywhere can be instantly read on-site, activating its full data record from the GIS or BIM platform. Today, the combination of GIS and RFID is used to verify and manage a vast array of items – from infrastructure assets to dinosaur bones. Berntsen offers a full range of RFID tags and software that integrate with GIS, BIM and other platforms to provide instant authentication to any asset, anywhere.Artificial Intelligence (AI)
AI is set to bring another wave of change to the way we live. AI is the ability of a machine to display human-like capabilities such as reasoning, learning, planning and creativity. AI enables technical systems to perceive their environment, deal with what they perceive, solve problems and act to achieve a specific goal. The computer receives data - already prepared or gathered through its own sensors such as a camera - processes it and responds. AI systems can adapt their behavior to a certain degree by analyzing the effects of previous actions and working autonomously[4].
Combining AI with geographic information system (GIS) and RFID technology delivers real-world context and authentication to operations.

According to Esri, close observers of AI have noted that as an analytic tool, much of what it accomplishes falls into three main categories in which AI and location intelligence fit seamlessly:
Automate tasks and repeat them quickly at scale. A utility company can use AI and location intelligence, along with drone [and RFID] technology, to examine utility poles and wires, determining where telltale signs suggest repairs are necessary.
Look at past patterns to make predictions. A logistics or manufacturing company can use AI and location intelligence to optimize supply chains, considering such disparate data as weather forecasts, the likelihood of ship and rail traffic backup, and how many left-hand turns there are on driving routes.
Search for patterns hidden in large amounts of data[5].
A key point

In the midst of the Fourth Industrial Revolution, it’s important to remember that there are some things that data, computing and visualization can’t do. Every person exists in the physical world, not as a consumer or data point, but as living, breathing, thinking being.
At Berntsen, we put people first, by caring for our customers, anticipating future needs, and providing personal support, from live webinars to one-on-one meetings. We all want to leave our mark, and Berntsen is here to help.
References:
[3] https://www.pointscan.co.uk/the-evolution-of-3d-laser-scanning/
[5] https://www.esri.com/content/dam/esrisites/en-us/media/ebooks/artificial-intelligence.pdf
Background:
https://www.landform-surveys.co.uk/news/thoughts/ai-surveying/
https://www.linkedin.com/pulse/emerging-trends-land-surveying-practices-primaverse/

NO MAN IS AN ISLAND - CELEBRATE GIS DAY!
GIS means Geographic Information Systems – the technology that allows us to tell a story using data points on a map. Almost any kind of data can be added to a physical location to illustrate everything from rainfall amounts over time understanding patterns of human movement. With GIS, geography is no longer relegated to rooms filled with dusty maps.
John Donne got it right 400 years ago in an essay that includes this famous passage:

No man is an island,
entire of itself,
every man is a piece of the continent,
a part of the main.
Today, we can literally see the truth of what Donne wrote in 1623 . . . just look at The Human Reach Story Map created by Esri. Any view of the story map will illustrate the depth, beauty and power of our interconnectedness.
Today is GIS day.
GIS means Geographic Information Systems – the technology that allows us to tell a story using data points on a map. Almost any kind of data can be added to a physical location to illustrate everything from rainfall amounts over time understanding patterns of human movement. With GIS, geography is no longer relegated to rooms filled with dusty maps.
How it began
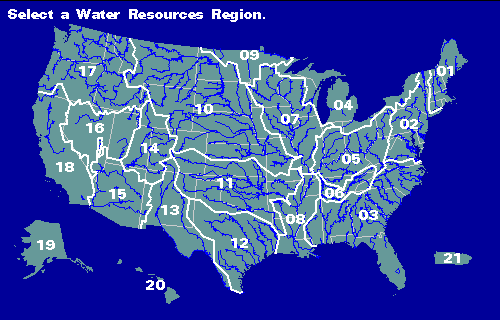
Hydrologic Unit Map from USGS
The concept of layering data over a map was first introduced by a German naturalist, Alexander von Humboldt. In 1817, he published the first isotherm map that showed the same average temperature over the globe. Before this map appeared, scientists had just assumed that average temperatures depended primarily on latitude. This map resulted in inquiries that led an understanding of how ocean currents, mountain ranges and other geography contribute to local climates.
In the 1960s, computers spurred the development of a new field of study – computational geography. In 1963, Roger Tomlinson was tasked with creating a manageable inventory of Canada’s natural resources. He realized his vision of using computers to store and process natural resource data with geographic data, and Geographic Information Systems was born. A year later, Harvard created the first computer mapping software, and in 1969, Jack and Laura Dangermond founded Environmental Systems Research Institute, Inc. (Esri).
Today, GIS gives us the tools to create our own digital maps to detect trends that can help solve problems.

3D imaging of Kilahuea Volcano, USGS
3D imaging of Kilahuea Volcano, USGS
This technology is a revelation.
We can now see what has previously been hidden, figuratively and literally. From macro problems such as climate change to locating physical structures, GIS is becoming an essential tool.
For example, during excavation, a utility contractor wants to avoid disturbing buried assets such as gas lines, electrical, water or fiber lines. GIS, combined with location data from physical markers, can reveal what lays underground – before excavation begins. Any type of asset can be marked and mapped, becoming visible and verifiable before digging begins.
InfraMarker mobile app and data management software
How’s it done?
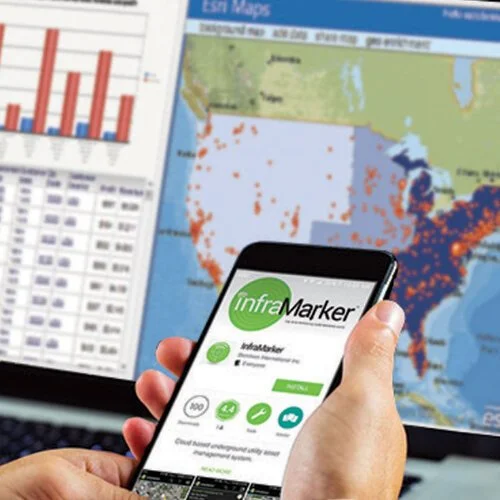
InfraMarker mobile app and data management software
Another common technology, Radio Frequency Identification (RFID) is combined with GIS to tag, identify and locate physical assets. It’s as simple as placing RFID markers on buried utilities, adding specific information about that location (a place where gas and fiber cross, for example) in a mobile app and then syncing that information with GIS.
This system, called InfraMarker®, was developed to help utilities accurately manage assets by pinning physical locations to virtually unlimited information. These pins contain specific, accurate location information that is linked to a wealth of data that is then displayed on a map – instantly viewable on a mobile app and in a GIS.
RFID markers are used in many industries for accurate tracking of inventory – and when combined with GIS, RFID provides true location intelligence – location verification and precision that can be used to improve operation workflows, reduce inspection reporting time and prevent excavation accidents. Utilities and other infrastructure owners now have a powerful, tool combines GIS accuracy with in-field location precision - making life easier for everyone dealing with infrastructure assets.